
Trending

The Fed’s “soft landing” hopes are likely overly optimistic. Such was the context of the recent #BullBearReport, which discussed the long record of the Fed’s economic growth projections. To wit:
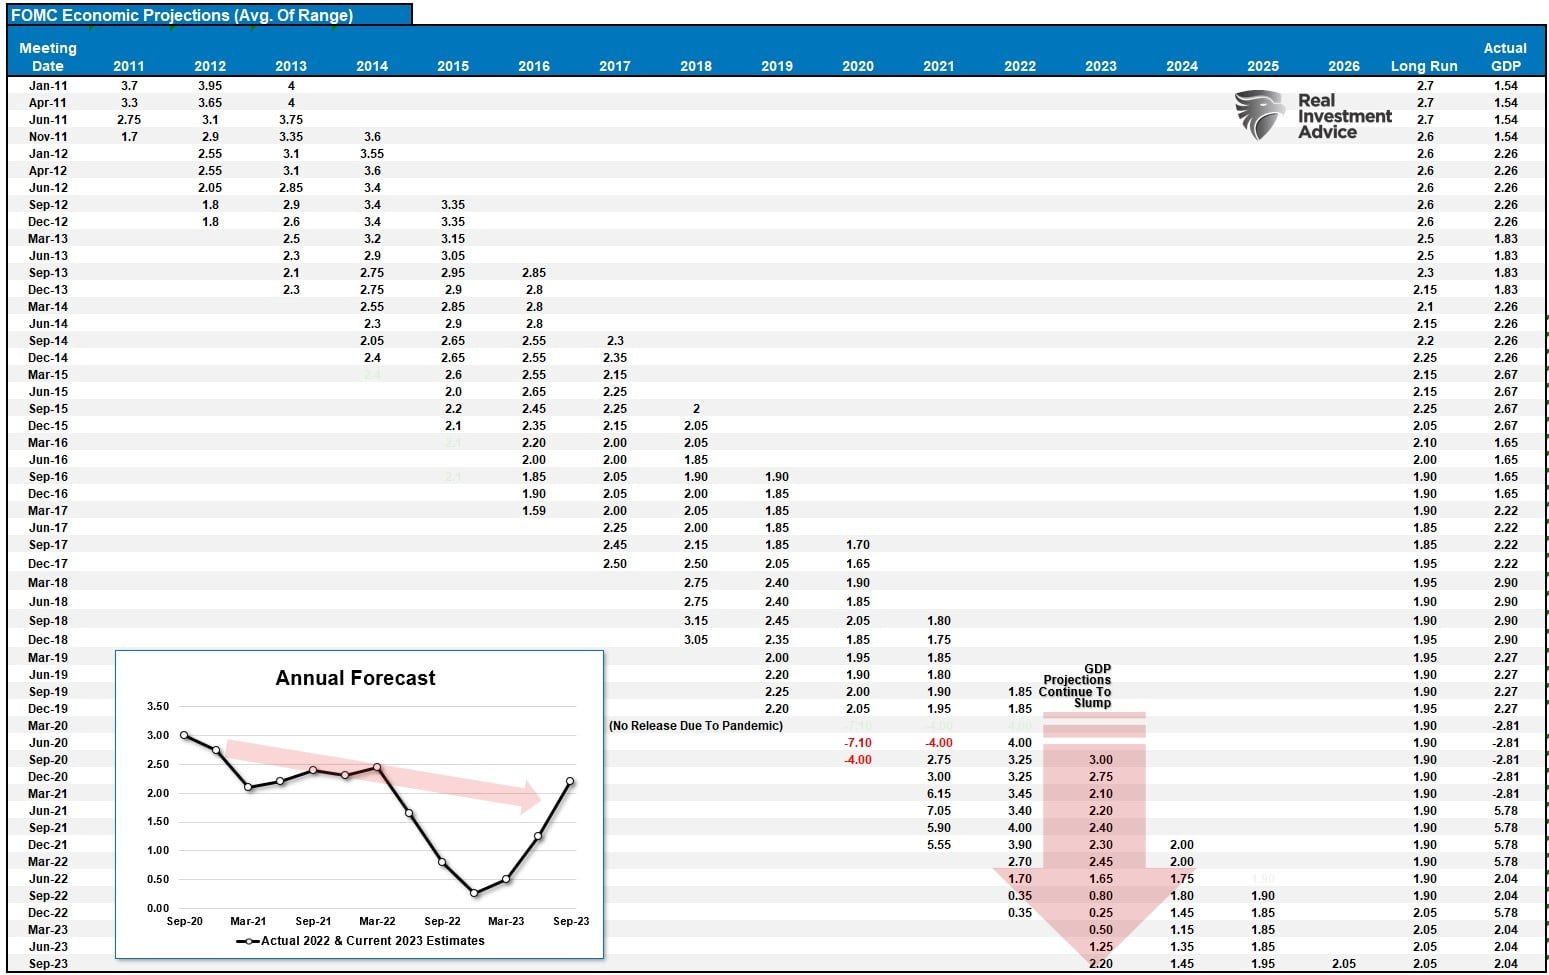
“However, there is a problem with the Fed projections. They are historically the worst economic forecasters ever. We have tracked the median point of the Fed projections since 2011, and they have yet to be accurate. The table and chart show that Fed projections are always inherently overly optimistic.
As shown, in 2022, the Fed thought 2022 growth would be near 3%. That has been revised down to just 2.2% currently and will likely be lower by year-end.”
As we noted, the Fed’s outlook for more robust growth allowed them to keep one rate hike on the table. While the prospect of further rate hikes spooked the stock and bond markets immediately following the announcement, as we discussed, such was needed to keep markets in line.
“The Fed projecting one last rate increase is also a way of preventing investors from immediately turning to the next question: When will the Fed cut? The risk is that as soon as investors start doing that, rate expectations will come down sharply, and with them, long-term interest rates, providing the economy with a boost the Fed doesn’t want it to receive just yet.
That is right. Since October last year, the market has been hoping for rate cuts and increasing asset prices in advance. Of course, higher asset prices boost consumer confidence, potentially keeping inflationary pressures elevated. Keeping a rate hike on the table keeps the options for the Federal Reserve open.“
Are the Fed’s “soft landing” hopes wrong?
Soft-Landing Hopes And Economic Realities
“On the eve of recessions in 1990, 2001, and 2007, many Wall Street economists proclaimed the U.S. was on the cusp of achieving a soft landing, in which interest-rate increases corralled inflation without causing a recession.” – Nick Timaros, WSJ
Similarly, the combination of easing inflation and a cooling labor market has fueled “soft landing” hopes among economists and Federal Reserve officials. However, soft landings are elusive as the Fed often holds rates too high for too long. Eventually, something breaks financially, economically, or both, leading to recessions and bear markets.
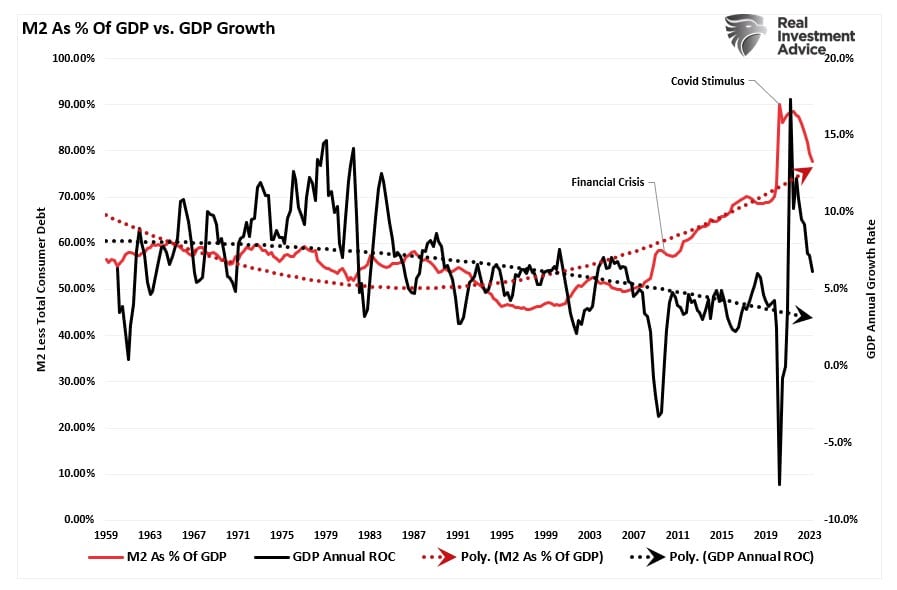
The Fed and most economists were wrong in 2022 when they forecasted an economic contraction. Economic growth, the labor market, and consumer spending proved unexpectedly resilient despite rising interest rates and elevated inflation. Much of that growth remains from the massive monetary liquidity still flowing through the economy.
With the restart of student loan payments, the UAW strike, and still high prices eating into consumer’s excess savings, that support is fading. However, other measures with near-perfect track records predicting recessions also suggest “soft landing” hopes are likely wrong.
Leading Indicators Lead
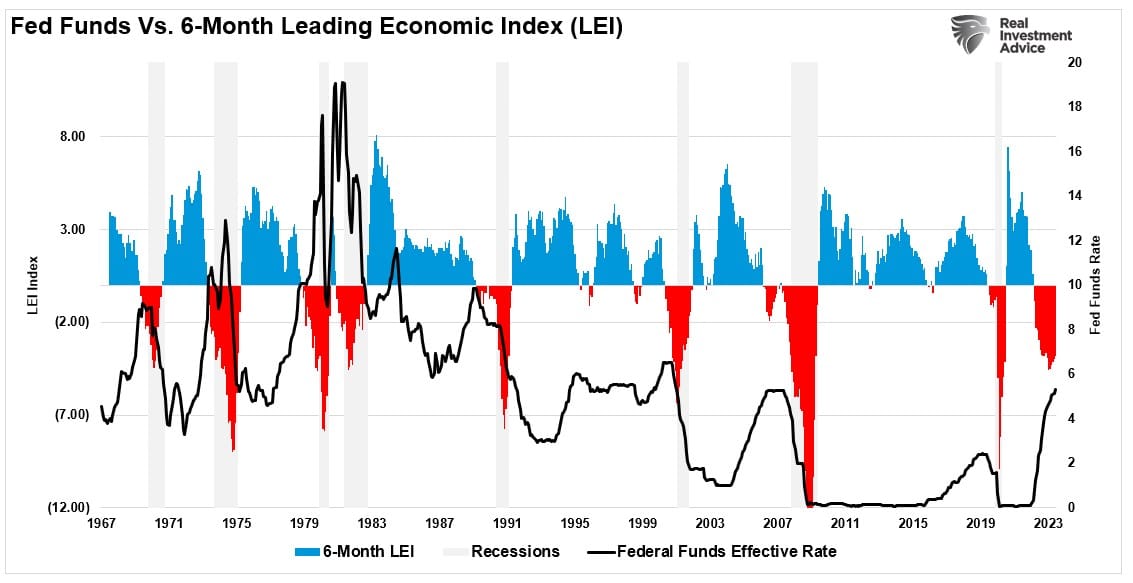
The Leading Economic Index is one of those indicators that should not be dismissed. As its name suggests, the data is forward-looking. With a negative reading for 17 months straight, the recession warning is quite evident. As shown, a recession occurred whenever the Fed hiked rates, and the 6-month rate of change in the LEI was negative by more than 2%.
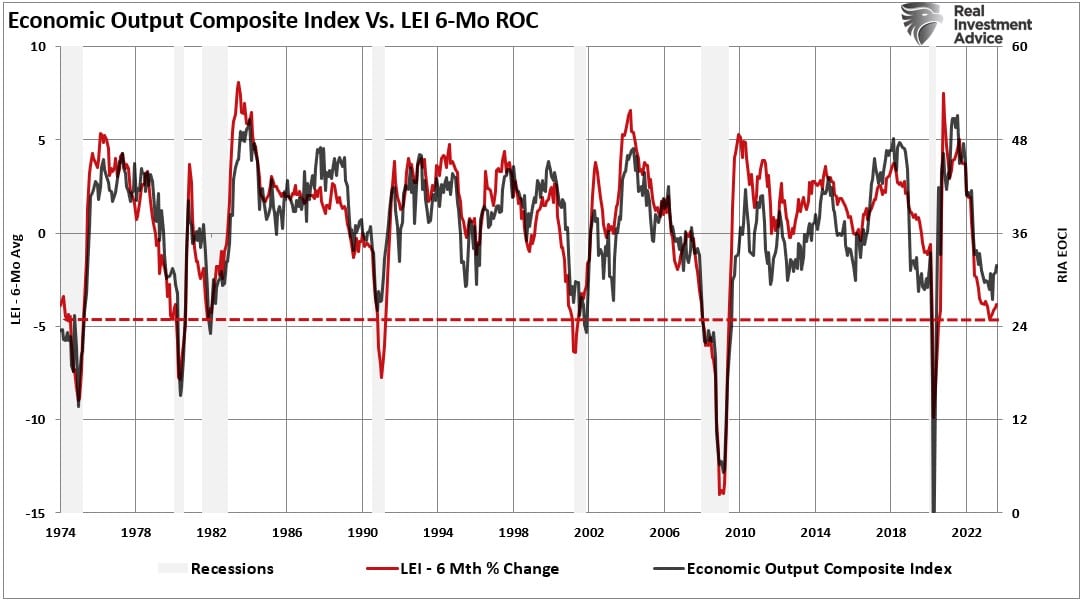
However, our own Economic Output Composite Index, which comprises more than 100 data points of hard and soft, leading and lagging indicators, confirms the warning of the leading economic index.
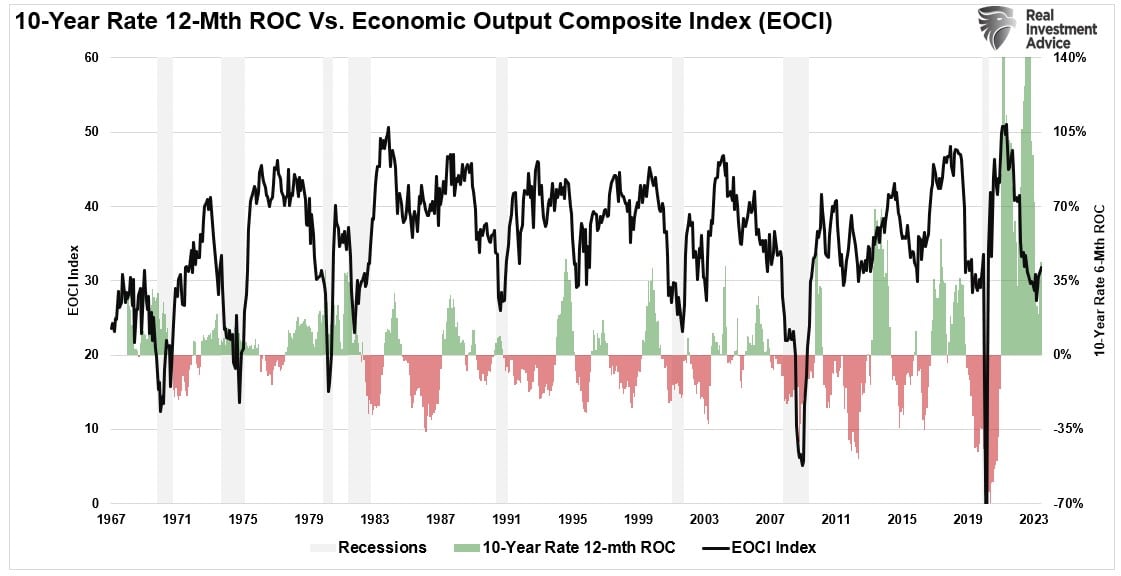
Notably, since we know that increases in interest rates impact economic growth, it is unsurprising that when the annual rate of change in interest rates spikes, economic growth slows. Given the magnitude of the current rate of change in interest rates on a heavily indebted economy, the “soft landing” hope seems to be a stretch.
But one indicator suggests recession is most prominent in the second half of 2024.
The Risk Of Recession In 2024 Is Likely
Of all the economic indicators we regularly review, one has continually preceded economic recessions. While “soft landing” hopes are high, the inversion of multiple yield curves suggests those hopes are misplaced. As discussed previously, the media always assumes this time is different regarding yield curve inversions because a recession didn’t occur immediately upon the inversion. There are two problems with this way of thinking.
- The National Bureau Of Economic Research (NBER) is the official recession dating arbiter. They wait for data revisions by the Bureau of Economic Analysis (BEA) before announcing a recession’s official start. Therefore, the NBER is always 6-12 months late, dating the recession.
- It is not the inversion of the yield curve that denotes the recession. The inversion is the “warning sign,” whereas the un-inversion marks the start of the recession, which the NBER will recognize later.
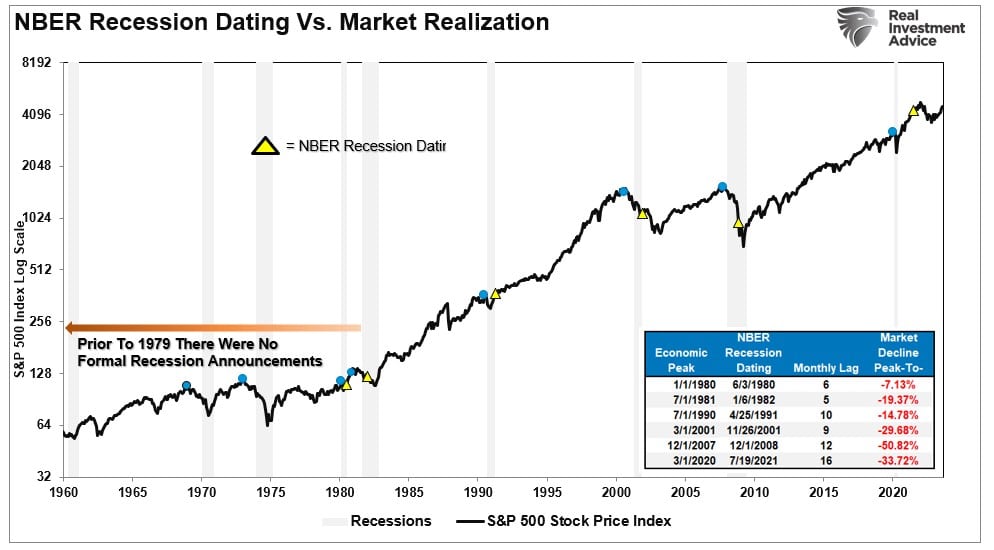
As discussed in “BTFD Or STFR,” if you wait for the official announcement by the NBER to confirm a recession, it will be too late. To wit:
“Each of those dots is the peak of the market PRIOR to the onset of a recession. In 9 of 10 instances, the S&P 500 peaked and turned lower prior to the recognition of a recession.“
While many analysts will focus on one yield curve inversion, we monitor and track ten different yield spreads affecting various economic areas. Currently, 90% of the yield spreads we monitor, shown below, are inverted, which historically is one of the best leading recessionary indicators. However, even then, it was several months before the economy slipped into recession.
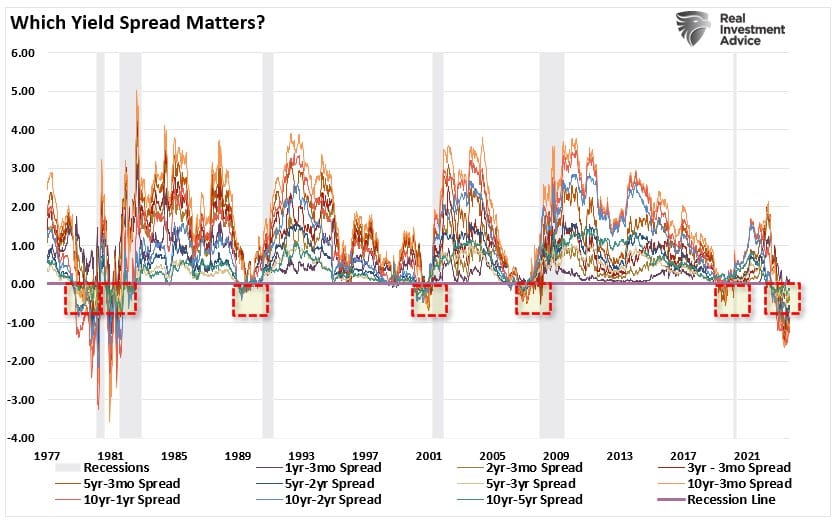
When these yield spreads turn negative, and a recession doesn’t occur immediately, the media discounts the risk. Such is why, before previous recessions, there were “soft landing” hopes. As shown, a recession followed an inversion of 50% or more of the tracked yield curves. Note that during the 1995 “soft landing,” yield curves never inverted. (Read this for a complete history.)

Conclusion
Most importantly, it is NOT the inversion of the yield curves that denote the onset of a recession. It is when the yield curve UN-inverts that marks the start of the recession. When the longer duration yields begin to fall, such will coincide with a decline in economic activity. Then, the “soft landing” hopes will fade into an economic recession reality.
The yield curve is sending a message that investors should not ignore. Furthermore, “risk-based” investors tend to act sooner rather than later. Of course, the contraction in liquidity causes the decline, eventually exacerbating the economic contraction.
Despite commentary to the contrary, the yield curve is a “leading indicator” of what is happening in the economy. However, the Fed remains focused on economic data that is “lagging” and subject to massive revisions.
While consumers may continue to support economic growth, such will change dramatically when job losses occur. As job losses increase, there is a rapid change in psychology.
Using the “yield curve” as a “market timing” tool is unwise. However, dismissing the message it is sending entirely is just as foolish.
History has not been kind to those that do.
Related: Compound Market Returns Are a Myth?