
Trending

The Fed got a welcome bit of news on Friday with the PCE price index. The Fed’s preferred measure of inflation fell to 2.2% on a year-over-year basis. That is the lowest reading since February 2021. The Fed’s 2% inflation target for PCE is now within reach by as early as year-end. However, the core PCE inflation measure, excluding food and energy, is 2.7%, so more work is needed on the inflation front. That said, the data was market-friendly as both the monthly PCE and Core indexes only rose by 0.1%, below the 0.2% market expectations. The monthly core PCE price index has been running at 1.5% annually over the last four months.
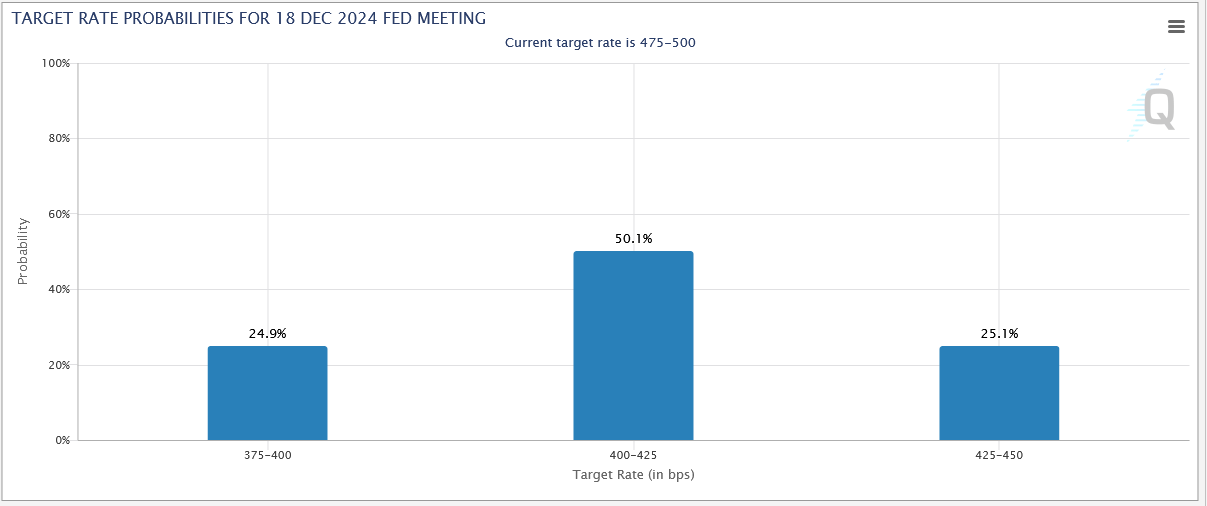
It’s too early for the Fed to declare their inflation mission accomplished. However, the recent PCE data and other inflation trends should give them comfort to keep reducing rates. Moreover, if the labor market continues to weaken, they could cut more aggressively than they or the market expect. As we share below, the market now assigns a 50% they cut by a total of 75bps by year-end. Furthermore, it assigns equal 25% odds that they cut by 100bps or 50bps.
What To Watch
Earnings

Economy

Market Trading Update
y, the market retested the breakout of the previous highs and held. Next week, if the market can hold these levels without breaking that support, the breakout will be confirmed, which should provide a bullish bias into the end of the month.”
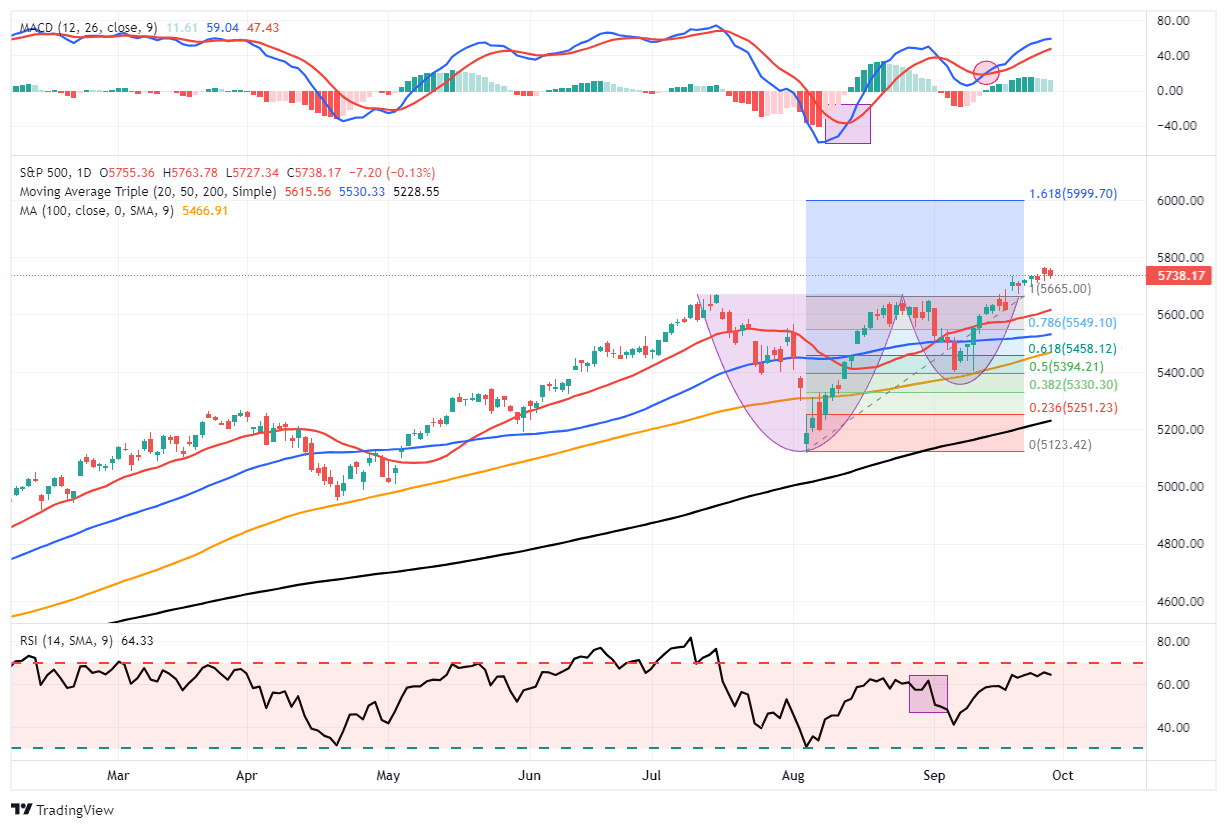
Such remains the case this week. Notably, completing the “cup and handle” pattern suggests a potential further upside to 6000 by year-end. While that target may seem ambitious, it aligns with recent Wall Street upgrades.
“The pattern was first described by William J. O’Neil in his 1988 classic book on technical analysis, How to Make Money in Stocks. A cup and handle price pattern on a security’s price chart is a technical indicator that resembles a cup with a handle, where the cup is in the shape of a ‘u’ and the handle has a slight downward drift. The cup and handle pattern is considered a bullish signal, with the right-hand side of the pattern typically experiencing lower trading volume. The pattern’s formation may be as short as seven weeks or as long as 65 weeks.”
That pattern seems quite evident in the following chart of the S&P 500 index. With the breakout of the “cup and handle” formation in place, a further rally into year-end seems to be the logical next step. Such suggests that any near-term correction to relieve overbought conditions should remain confined to the bullish trend. In other words, investors should consider buying any near-term declines.
Just for reference, the last time we discussed a cup and handle formation was in December 2023, where we noted:
“That pattern seems quite evident in the following weekly chart of the S&P 500 index. With the breakout of the “cup and handle” formation in place, an attempt at all-time highs seems to be the logical next step. Any subsequent correction to relieve overbought conditions should maintain the bullish trend line from the March 2020 lows.”
While I received some pushback at the time, the market has rallied and set numerous new all-time highs this year.
The pattern is bullish, but it does not mean the market is guaranteed to rise. As is always the case, manage risk accordingly.
The Week Ahead
The market’s attention will shift from inflation to the labor market. JOLTs on Monday, ADP on Wednesday, and the BLS employment report on Friday will heavily impact the Fed’s next rate decision. Current expectations are for the addition of 142k jobs, with the unemployment rate staying stable at 4.2%. Also on the docket is the ISM manufacturing and services surveys. These will help us further assess executives’ sentiment on the labor market, as well as their overall confidence and views on price trends.
Monday is quarter-end. We may see volatile price action related to quarter-end window dressing on Monday and the following couple of days. As we saw last week, a slew of Fed members will speak. The speeches on Friday, following the BLS report, could be the most interesting.
Tax Cuts- An Examination Of The 2017 TCJA Impact
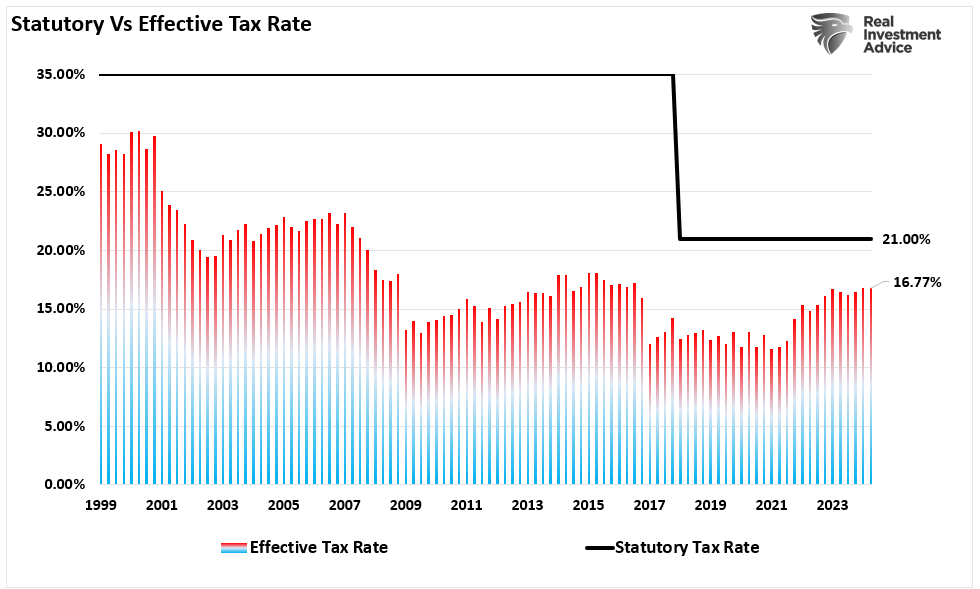
Corporate tax rate reductions in the United States have delivered tangible economic benefits, including increased capital investment, job creation, wage growth, and enhanced global competitiveness. The Tax Cuts and Jobs Act of 2017 is a key example of how reducing corporate tax rates can stimulate economic activity. Companies like Apple, Walmart, and Pfizer have used their tax savings to reinvest in the U.S. economy, create jobs, raise wages, and bolster their global standing.
While the long-term effects of corporate tax cuts continue to be debated, there is no denying that, when implemented strategically, they can positively impact the broader economy. Furthermore, following the TCJA, tax receipts increased even though tax rates declined. Such is expected if the economy benefits from tax cuts. However, as noted above, those benefits were cut short by the onset of the pandemic and confounded by the massive interventions following.
Tweet of the Day
“Want to achieve better long-term success in managing your portfolio? Here are our 15-trading rules for managing market risks.”