
Trending

The Adobe Digital Price Index claims to use data from over one trillion online consumer transactions comprising over 100 million unique product SKUs. While those are massive numbers, Statista estimates only 16% of retail sales will come from online transactions in 2024. Despite the relatively small percentage, over 75% of adults shop online, and over half shop online at least once a week. Therefore, in-store prices must stay somewhat competitive with online prices. As such, Adobe’s price index provides a decent price gauge for consumer goods and may even prove to be a leading indicator of consumer price trends. With that, we present a few interesting data points and graphs from the latest Adobe data.
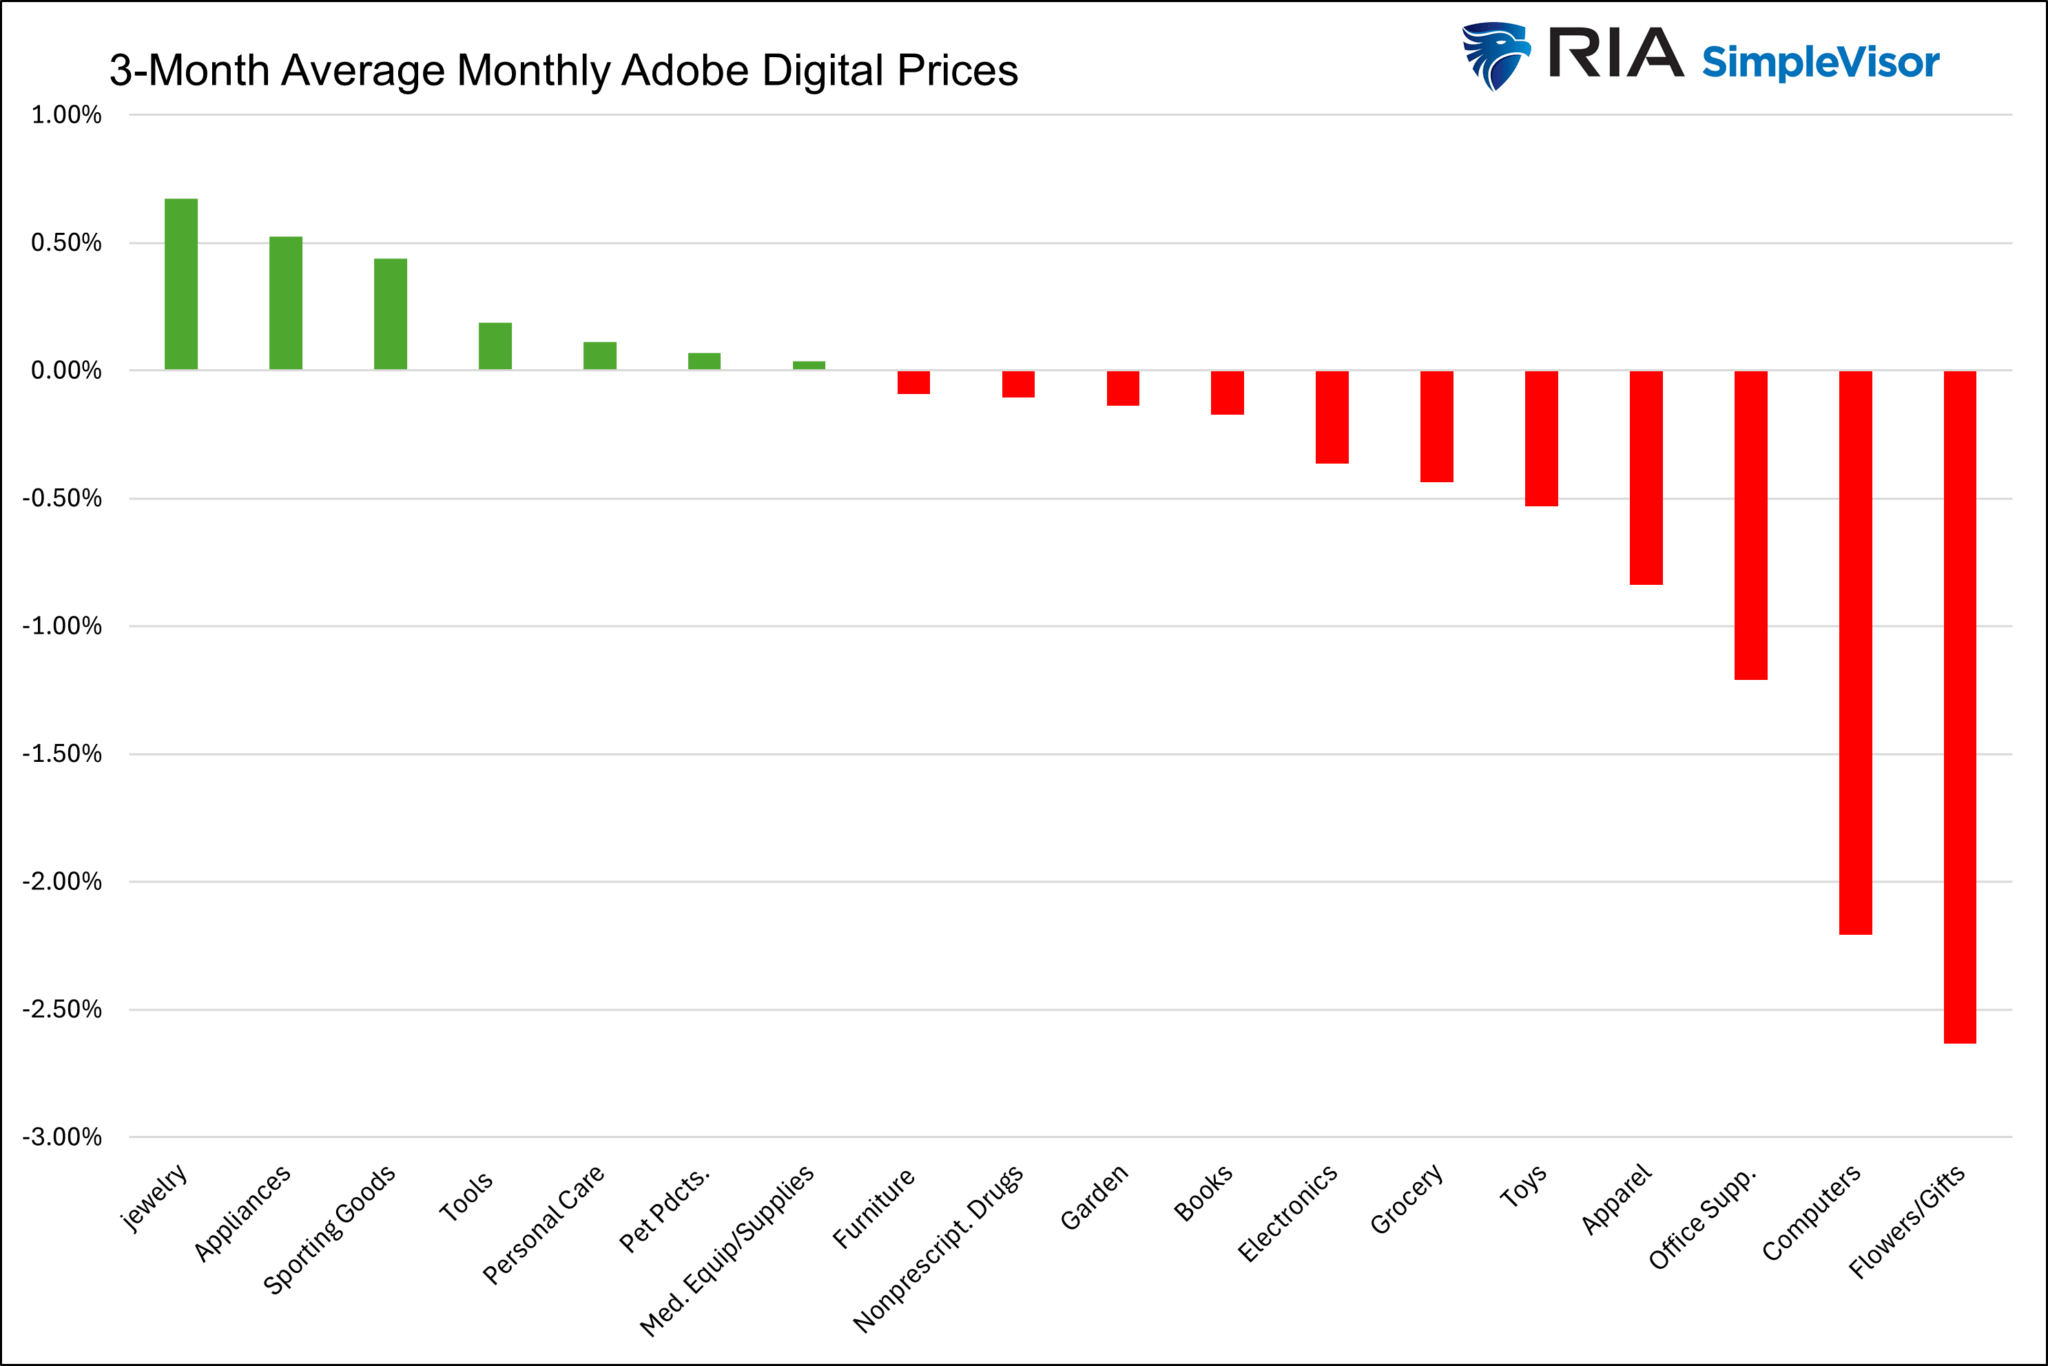
- Monthly grocery prices fell 3.7% in August and are running +.48% year over year. That is the lowest monthly figure since the index started in 2014.
- The graph below shows that of the 18 price categories they track, 11 have been declining on average over the last three months.
- Adobe claims prices fell .24% in aggregate last month, bringing the year-over-year rate to -4.37%.
Austan Goolsbee and Pete Klenow created the Adobe model. Goolsbee was recently appointed as the President of the Chicago Federal Reserve. The data we present may help explain why he seems more confident than other Fed members that inflation will return to the Fed’s 2% target.
What To Watch
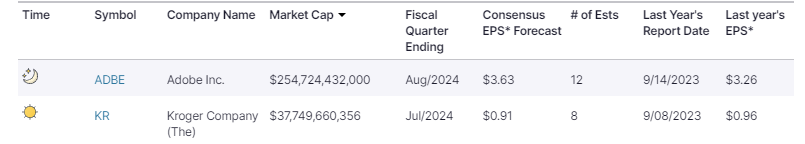
Earnings
Economy

Market Trading Update
Yesterday, we discussed how bonds were overbought short-term and needed a bit of a correction. Yesterday’s CPI print, with core inflation rising, may have started that correction. However, today’s PPI print will also be important. The inflation print was cool enough at the headline to spark a stock market rally as investors settle in on a 25 basis point cut at the Fed meeting next week.
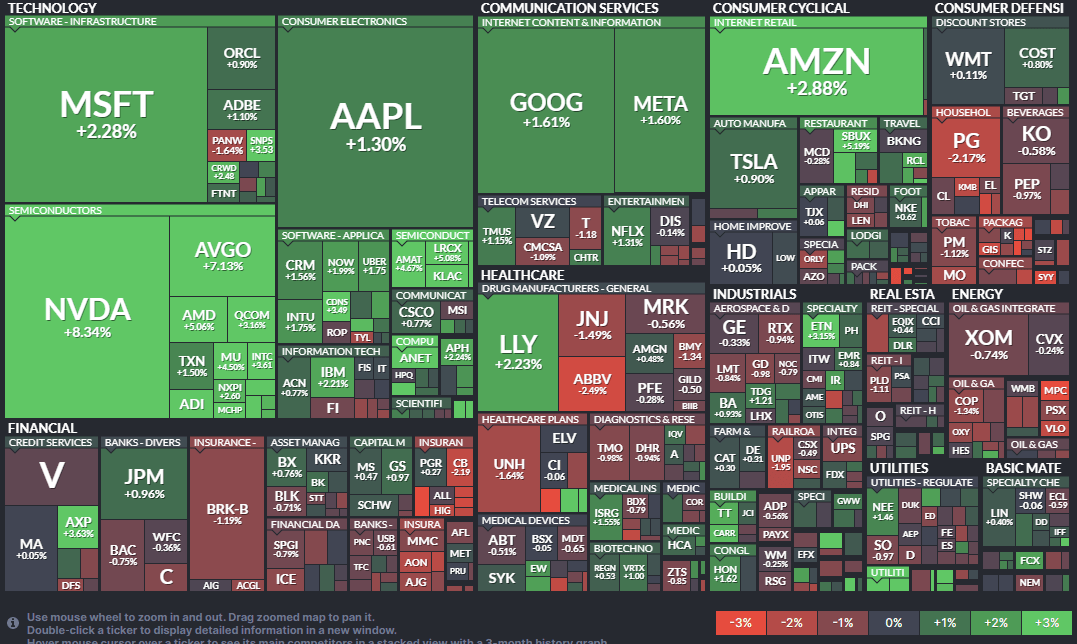
Notably, yesterday’s rally was a return of the “Magnificent 7,” which has been under pressure lately. However, these companies, in particular, generate a vast portion of the overall earnings growth in the index. With inflation coming down and personal consumption remaining steady, the earnings for these companies will likely continue to drive the markets for now.
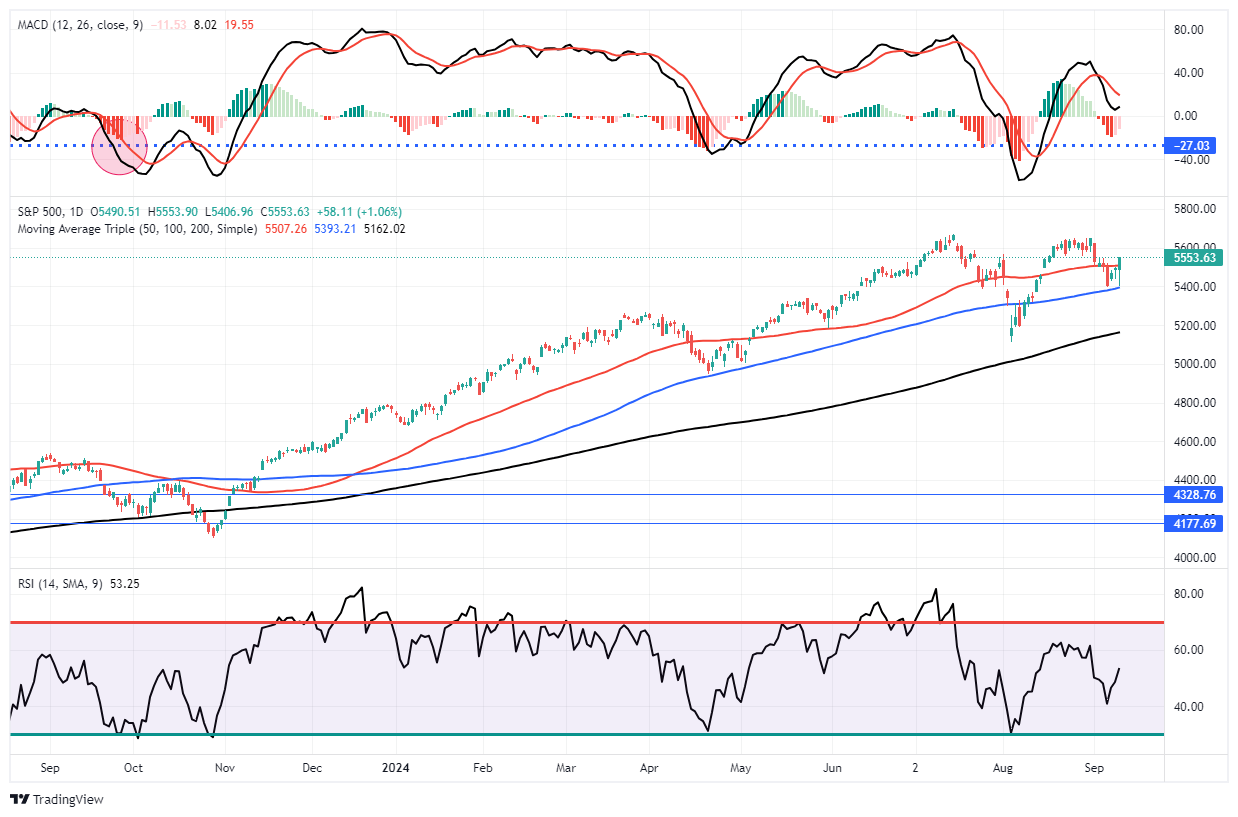
Technically speaking, yesterday’s rally was extremely bullish. In the morning, the market initially sold off following the CPI report. However, as the markets digested the data, buyers entered at the 100-DMA and drove the market above the 50-DMA by the end of the day. That successful test of support and break of overhead resistance sets the market up to retest recent highs. With the market not overbought and the MACD beginning to turn higher, we should see some follow-through buying today if the Producer Price Index confirms the trend of weakening inflationary pressure.
Continue to manage exposures. While the market does not have an “all clear” just yet, yesterday’s action was very encouraging.
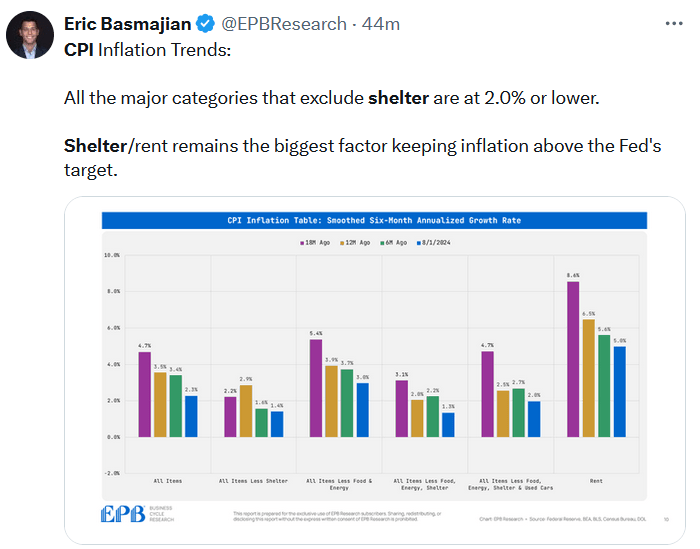
The CPI Report
Headline CPI came in as expected, rising 0.2% monthly and 2.5% annually. Core CPI was a tenth higher than expectations at 0.3%, but on a year-over-year basis, met expectations of 3.2%. Notably, the annual inflation rate fell from 2.9% to 2.5%. The decline was due to a monthly annualized inflation reading of 4.3% from 13 months ago dropping out of the calculation. This is the lowest inflation reading since March 2021.
Once again, shelter prices account for nearly all of the monthly gains. Shelter prices were up 0.5%. As shown below, CPI less shelter has been at zero for the last two months and is slightly negative for the previous three months. As we continually harp on, when CPI shelter prices catch up with real-time price indicators of rents, CPI will take another leg lower, possibly into deflationary territory.
The data further confirms that the Fed will likely cut rates by 25 bps next week. As implied by Fed Funds futures, the odds of a 50bps cut is 12%, down from over 50% a week ago.

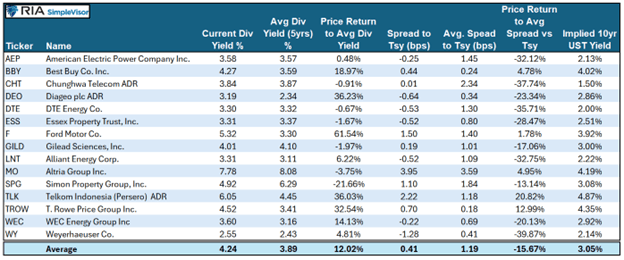
Cash Cows Inform Us On Yields
We have written many articles and commentaries forecasting interest rates. The analysis has used prior and current inflation and economic activity. Additionally, we have looked at market data on inflation expectations, Fed Funds futures, and other factors that influence interest rates. Today, we add an unorthodox factor to the list: cash cows.
This article introduces a unique way to imply where dividend investors think interest rates will be in the future.
Tweet of the Day
“Want to achieve better long-term success in managing your portfolio? Here are our 15-trading rules for managing market risks.”
Related: Is Bitcoin a Valuable Asset To Own During Fed Rate Cuts?