
Trending

The recent sell-off has certainly sparked concerns with investors but the NYSE advance-decline line is an important technical measure to watch. However, what is it, and why does it matter?
The NYSE Advance-Decline (A/D) Line is one of the most crucial market breadth indicators that investors watch to assess the overall health of the stock market. Unlike traditional stock indices that focus on price movements of a handful of large-cap stocks, the A/D Line provides a more comprehensive view by measuring how many stocks are participating in a market trend. It is calculated daily by subtracting the number of declining stocks from the number of advancing stocks on the New York Stock Exchange (NYSE) and adding this net figure to the previous day’s total, creating a cumulative line. The chart below compares the NYSE Advance-Decline (A/D) line to the S&P 500. Unsurprisingly, the market has a high correlation to the NYSE A/D line.

This indicator is particularly valuable because it helps investors confirm whether a market rally is broad-based or driven by just a few influential stocks. If indices like the S&P 500 or Dow Jones Industrial Average are hitting new highs while the A/D Line is rising, it signals strong market participation and suggests the rally is sustainable. However, if stock indices are climbing but the A/D Line is declining or stagnating, it could indicate that fewer stocks are driving the gains, potentially warning of weakening momentum and a possible market reversal. This divergence can serve as an early warning sign for investors, helping them anticipate corrections before they happen. As shown, that is what happens before significant market reversals.
Beyond trend confirmation, the A/D Line is a leading indicator for broader market trends. A steadily rising A/D Line suggests continued market strength, while a declining line can be a red flag for potential downturns. Additionally, it can help investors identify when a few large-cap stocks are manipulating market movements. If the indices push higher while most stocks decline, it might indicate a fragile market structure rather than a true bull market.
For example, the NYSE A/D line provided a significant warning before the Brexit correction in late 2015 and early 2016. Unfortunately, even though the NYSE A/D line coincided with the Fed’s taper tantrum in 2018 and the onset of the pandemic in 2020, it still provided a strong clue to reduce exposure. However, in late 2021, amid the stimulus-fueled stock frenzy, the NYSE A/D began to stagnate nearly six months before the correction eventually took hold. While exuberance was highly elevated and asset prices were rising, the continued stagnation of the A/D line was a clear warning to investors. It is worth noting, and something we will discuss further momentarily, that the NYSE A/D line is once again stagnating while asset prices remain close to all-time highs.

For investors and traders, monitoring the A/D Line can provide key insights into market conditions that price-based indices alone may not reveal. However, by combining the NYSE A/D line with other indicators, we can better understand the overall market’s health.
Additional Measures To Monitor
Technical analysis is crucial in helping investors identify market trends, momentum shifts, and potential entry or exit points. Two of the most widely used indicators in this space are the Relative Strength Index (RSI) and the Moving Average Convergence Divergence (MACD). While media headlines and narratives are generated to get clicks and views, understanding the basics of technical indicators can help investors navigate volatile markets and improve results.
Let’s start with the relative strength index.
What is RSI?
The Relative Strength Index (RSI) is a momentum oscillator that measures the speed and magnitude of recent price changes to evaluate whether a stock or market is overbought or oversold. RSI ranges from 0 to 100, with readings above 70 typically indicating overbought conditions (potentially signaling a pullback) and readings below 30 suggesting oversold conditions (a possible buying opportunity).
RSI is beneficial for spotting reversals and trend strength. A stock with an RSI above 70 for an extended period may be due for a correction. Conversely, if RSI falls below 30 but begins to rise, it could indicate a rebound is on the horizon. A key to reversals is divergences, where price trends and RSI movements disagree. For example, a rising RSI while markets are declining, or vice versa, often signals upcoming trend shifts. The market has risen since August despite an ongoing decline in RSI. That negative divergence was a strong precursor to the current correction. However, with the market testing the 200-DMA and RSI near 30, investors should start looking for a reflexive rally.
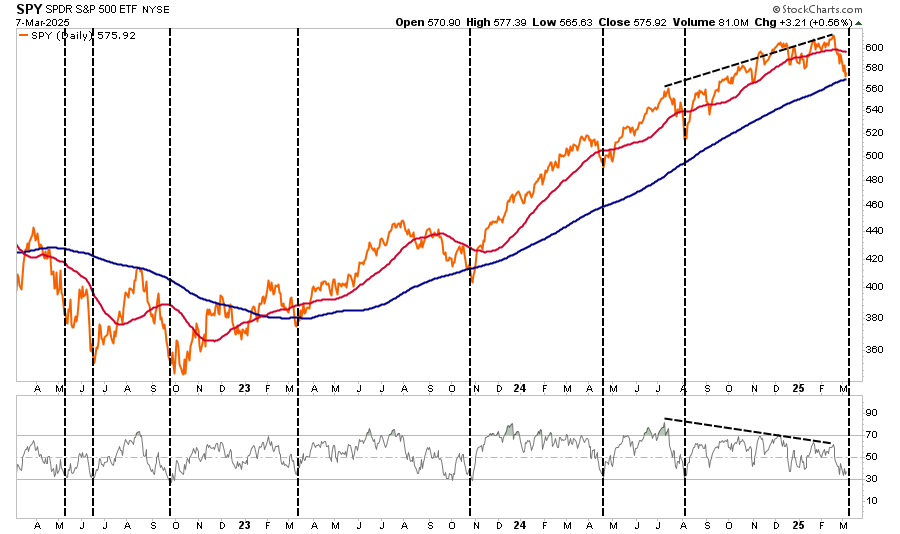
RSI doesn’t tell us whether that reflexive rally is the start of a new bull market trend or a rally within a potential correction or consolidation period. We can look at a different confirming indicator: the MACD.
What is MACD?
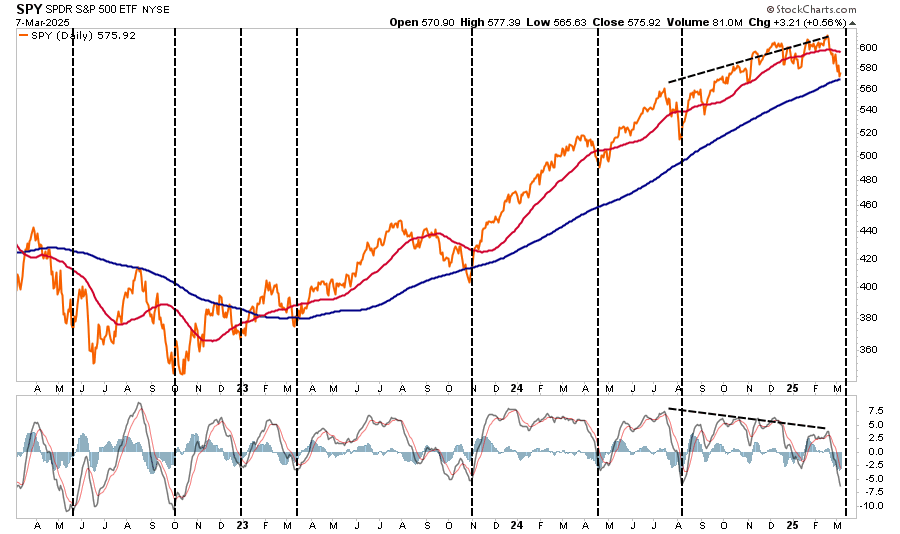
The Moving Average Convergence Divergence (MACD) is a trend-following momentum indicator that helps investors spot changes in momentum and trend direction. It consists of two lines:
- The MACD Line is calculated by subtracting the 26-day Exponential Moving Average (EMA) from the 12-day EMA.
- The Signal Line is a 9-day EMA of the MACD Line.
When the MACD Line crosses above the Signal Line, it generates a bullish signal, suggesting increasing upward momentum. Conversely, when the MACD Line crosses below the Signal Line, it produces a bearish signal, indicating potential downside. The MACD also features a histogram, visually representing the difference between the MACD and Signal Line. Expanding bars indicate strengthening trends while contracting bars suggest weakening momentum.
Again, as with the RSI, there are two essential points. First, the negative divergence since last August warned of a potential corrective phase. Secondly, the current deep oversold condition of the MACD suggests a reflexive rally is likely.
Why Should Investors Pay Attention to RSI and MACD?
The RSI and MACD indicators help investors make better entry and exit decisions. By identifying overbought and oversold conditions, momentum shifts, and trend confirmations risk management becomes more timely. RSI is best used to gauge momentum and potential reversals. The MACD is more effective in spotting trend direction and strength. When used together, these indicators provide a clearer picture of market conditions, reducing the risk of false signals. Such was a point I addressed in last week’s #BullBearReport:
“During bull markets, relative strength tends to oscillate between 50 and 100, while the momentum, as measured by the MACD indicator, tends to stay above 50. The opposite is true in bear markets. During bull markets, buying opportunities tend to exist when corrections push indicators toward the lower levels of their weekly readings. Bear markets provide buying opportunities at the lowest levels. However, the most critical indicator is the weekly moving average crossover. That crossover historically has been a strong indication that portfolios should become more “risk-off” positioned until that signal reverses. The crossover dictates the change in the market from a bullish to a bearish trend.”
The chart below is a long-term weekly chart of RSI and MACD indicators. I have denoted when the indicators are trading in bullish and bearish trends. The primary signal is the crossover of the weekly moving averages, as noted by the vertical lines. While the MACD and RSI indicators provided early warning signals, the moving average crossover confirmed a market correction or consolidation. These indicators will not necessarily cause a risk reduction precisely at the top. However, they generally provide sufficient indications to reduce risk ahead of more significant market corrections and consolidations.
Conversely, they also offered signals when investors should increase market equity risk. These signals were instrumental in avoiding the 2008 market crash and the 2022 correction. Currently, the RSI is crossing below 50, which may suggest a continued correction process with the MACD beginning to revert. However, the moving average crossover has not yet confirmed the messages from both the RSI and MACD.
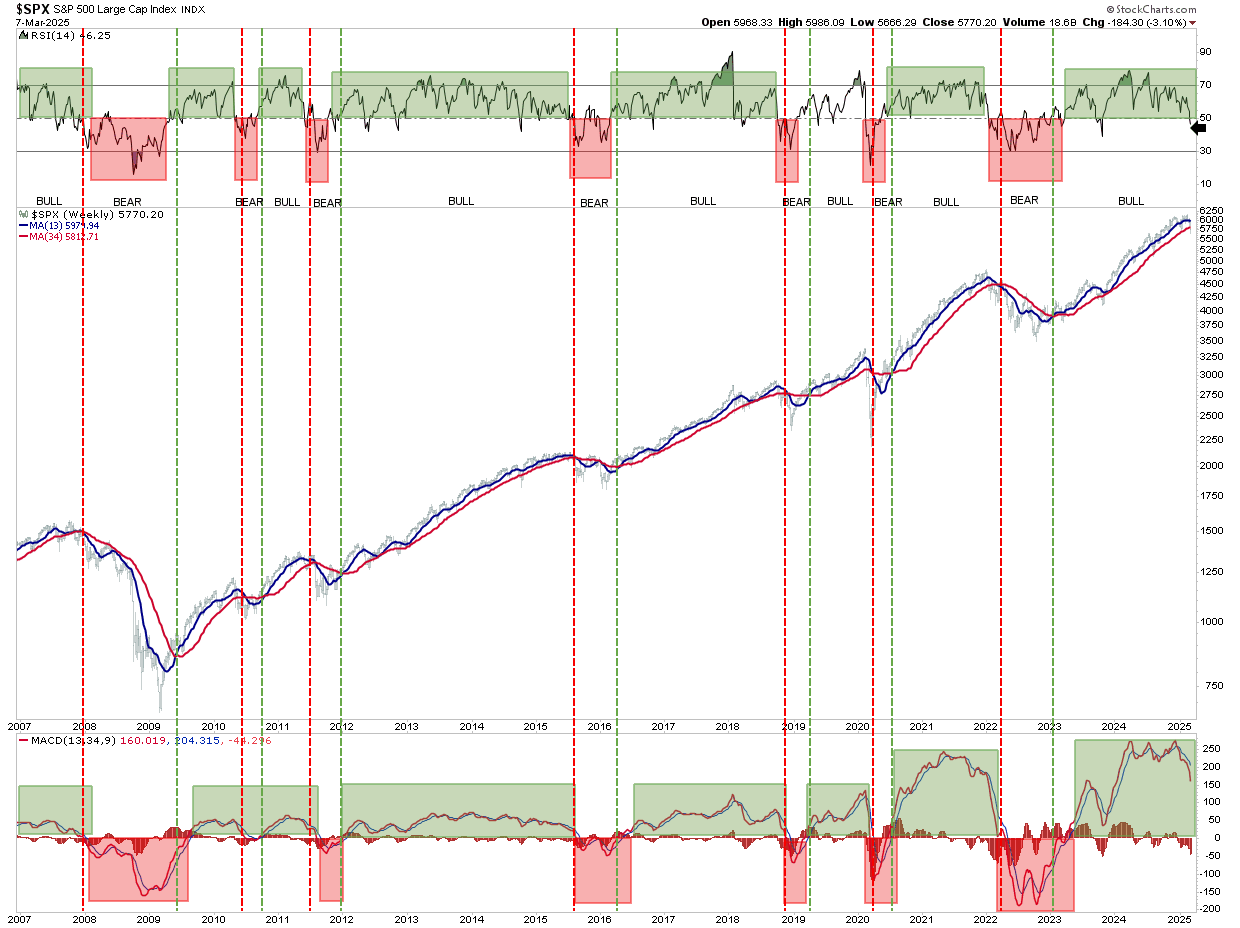
The market is currently telling us that the risk of a more significant correction or consolidation process is increasing. While such does not preclude a significant counter-trend rally in the short term, the longer-term risks seem to be growing.
Navigating A Potentially Uncertain Market
As we have discussed since the beginning of this year, the risk of disappointment remains elevated. Wall Street analysts remain optimistic about earnings and economic growth, but market behaviors tell a different story. Volatility is rising, and as we stated previously, volatility is likely to be a regular “dance partner” this year as markets come to grips with slower economic growth, rising political uncertainty, and over-valued markets.
We, nor does anyone else, know how the market will end this year. This is why technical indicators play a crucial role in helping investors gauge market momentum, trend strength, and potential reversals. As of early March 2025, several key indicators—the NYSE Advance-Decline (A/D) Line, Relative Strength Index (RSI), and Moving Average Convergence Divergence (MACD)—are signaling caution, suggesting that investors should take a closer look at their risk management strategies.
Given these warning signs, investors should proactively manage risk and protect their portfolios.
Step 1) Clean Up Your Portfolio
- Tighten up stop-loss levels to current support levels for each position.
- Hedge portfolios against significant market declines.
- Take profits in positions that have been big winners.
- Sell laggards and losers.
- Raise cash and rebalance portfolios to target weightings.
The next step is to rebalance your portfolio to the allocation that will most likely weather a “cold snap.” In other words, consider what sectors and markets will improve in whatever economic environment you believe we will experience in 2025.
Step 2) Compare Your Portfolio Allocation To The Model Allocation.
- Determine areas requiring new or increased exposure.
- Calculate how many shares need to be purchased to fill allocation requirements.
- Determine cash requirements to make purchases.
- Re-examine portfolio to rebalance and raise sufficient cash for requirements.
- Determine entry price levels for each new position.
- Evaluate “stop-loss” levels for each position.
- Establish “sell/profit taking” levels for each position.
(Note: the primary rule of investing that should NEVER be broken is: “Never invest money without knowing where you are going to sell if you are wrong, and if you are right.”)
However, even during bearish trending markets, opportunities will be presented for significant rallies and eventual market lows if such should occur. Therefore:
Step 3) Have positions ready to execute accordingly, given the proper market set-up. In this case, we are looking for positions that have either a “value” tilt or have pulled back to support and provide a lower-risk entry opportunity.
While market conditions remain uncertain, preparing and adjusting strategies accordingly can help investors confidently navigate volatility. As technical indicators flash warning signs, a well-structured risk management approach will protect capital and preserve long-term gains.
I hope this helps.