
Trending

Written by: Przemyslaw Radomski, CFA
Investors prick up their ears to front-run the FED’s taper. It looks like a tricky game though, given its contradictory statements – what’s the truth?
You Don't Say!
At first it was nothing, then it was something, and now it’s…
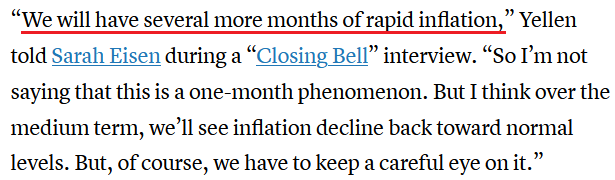
Source: CNBC
Speaking with CNBC on Jul. 15, U.S. Treasury Secretary Janet Yellen – who preceded Jerome Powell as the Chairman of the U.S. Federal Reserve (FED) – said that declining long-term Treasury yields is “the market expressing its views that inflation does remain under control.” However, while the contradictory statements of “several more months of rapid inflation” and “inflation does remain under control” are quite humorous, she has a point: with bond investors eager to front-run the FED’s forthcoming taper, the U.S. 10-Year Treasury yield has been the main casualty. And with gold often moving inversely of the U.S. 10-Year real yield, the development has strengthened the yellow metal.
Please see below:
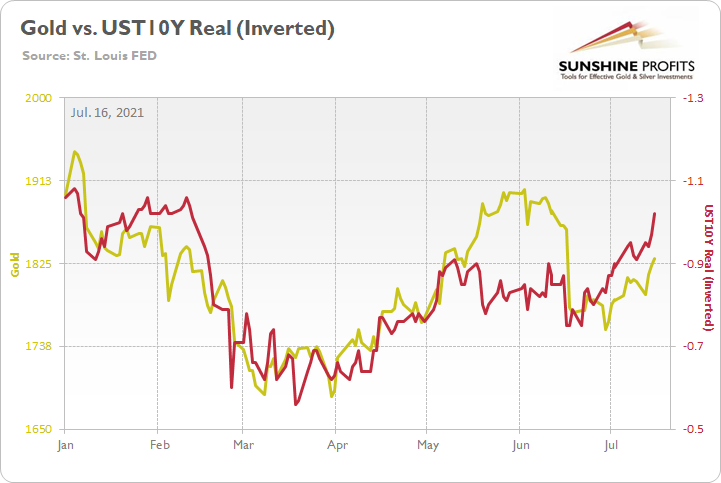
To explain, the gold line above tracks the London Bullion Market Association (LBMA) Gold Price, while the red line above tracks the inverted U.S. 10-Year real yield. For context, inverted means that the latter’s scale is flipped upside down and that a rising red line represents a falling U.S. 10-Year real yield, while a falling red line represents a rising U.S. 10-Year real yield.
If you analyze the relationship, you can see that one’s pain is often the other one’s gain. And if you focus your attention on the right side of the chart, you can see that the U.S. 10-Year real yield’s recent malaise has uplifted the yellow metal.
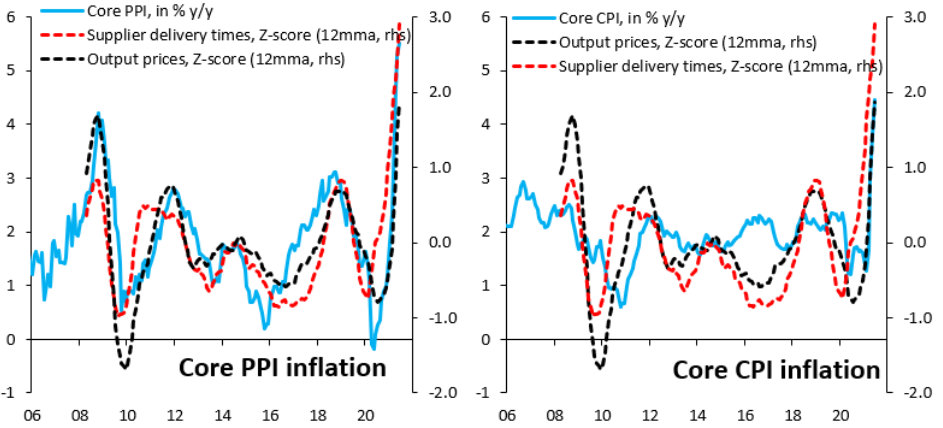
Despite that, while Powell and Yellen continue to make excuses for their lack of foresight, Powell actually told Congress on Jul. 15 that surging inflation caught ‘everyone’ by surprise.
Please see below:
Source: CNBC
However, while I’ve been warning for months that inflation was likely to boil, both policymakers are underestimating the lasting effects. And in the process, bond investors have buried their heads in the sand. Conversely, while “temporary” and “transitory” remain Powell’s favorite buzzwords, supply chain disruptions still haven’t fully filtered into the core Consumer Price Index (CPI).
Please see below:
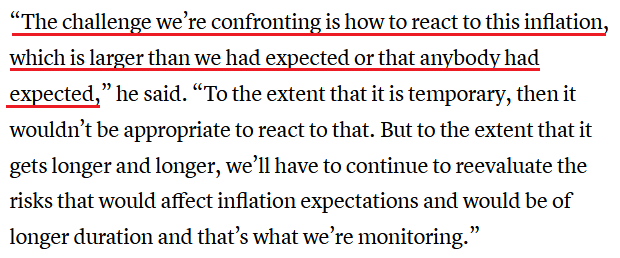
Source: Robin Brooks/Institute of International Finance (IIF)
To explain, the chart on the left depicts the effect of supplier delivery times on the core Producer Price Index (PPI). If you analyze the relationship, you can see that the red and light blue lines are roughly three standard deviations above their historical average (follow the scales on the right side of both charts). Conversely, if you analyze the chart on the right, you can see that the core CPI (the light blue line) is still less than two standard deviations above its historical average. As a result, the core CPI still hasn’t felt the brunt of the inflationary surge.
What’s more, the New York FED released its Empire State Manufacturing Survey on Jul. 15. And with one header reading “Selling Prices Increase at Record-Setting Pace,” cost-push inflation remains alive and well.
Please see below:
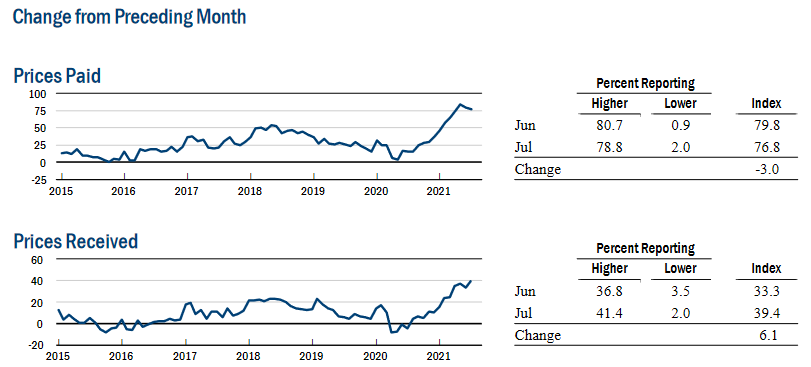
Source: NY FED
In addition, New York’s’ manufacturing sector expanded rapidly and supply chain disruptions (delivery times) remain an issue. An excerpt from the report read:
“Business activity grew at a record-setting pace in New York State, The headline general business conditions index shot up twenty-six points to 43.0. New orders and shipments increased robustly. Delivery times continued to lengthen substantially, and inventories expanded. Employment grew strongly, and the average workweek increased. Input prices continued to increase sharply, and selling prices rose at the fastest pace on record. Looking ahead, firms remained optimistic that conditions would improve over the next six months, with the index for future employment reaching another record high.”
Turning to the second major player in gold’s bearish forecast, the USD Index is hitting its stride. And as sentiment shifts, the U.S. dollar is gaining significant support from speculators.
Please see below:
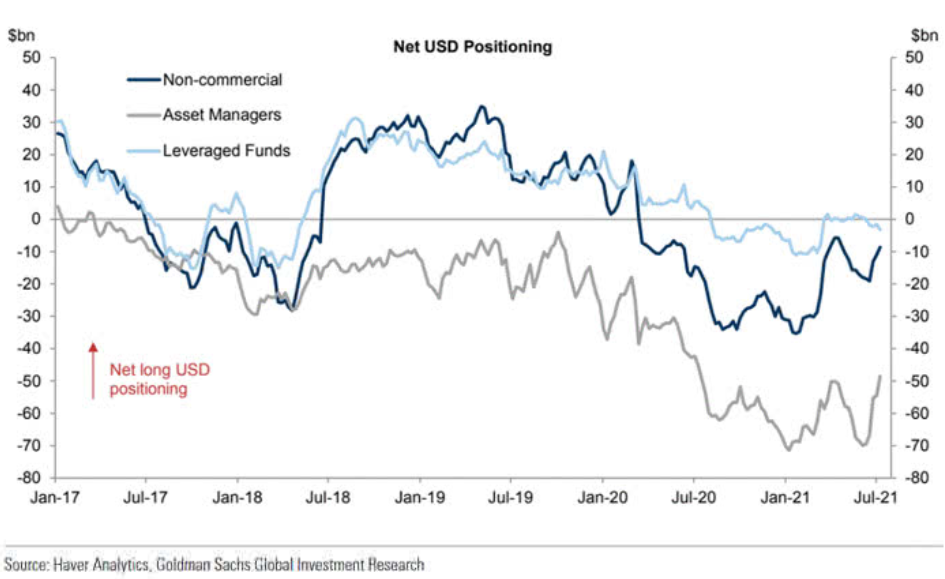
To explain, the dark blue, gray and light blue lines above represent net-long positions of non-commercial (speculative) futures traders, asset managers and leveraged funds. When the lines are falling, it means that the trio have reduced their net-long positions and are expecting a weaker U.S. dollar. Conversely, when the lines are rising, it means that the trio have increased their net-long positions and are expecting a stronger U.S. dollar. And if you analyze the right side of the chart, you can see that non-commercial futures traders and asset managers have completely changed their tune (though leveraged funds’ movement has been minimal).
On top of that, the latest USD Outlook from Vanda Research offers an interesting take on the FED’s forthcoming taper. Predicting that a ‘buy the rumor, sell the news’ event will unfold over the next several weeks, the firm believes that speculators will likely front-run the expected announcement.
Please see below:
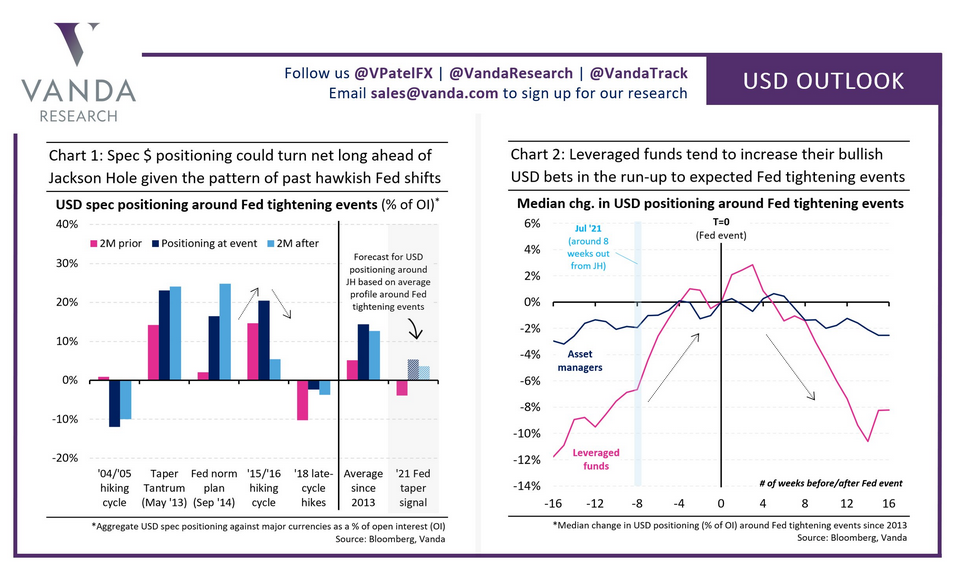
To explain, if you analyze the first chart on the left, the pink bars (two months before), the dark blue bars (actual event) and the light blue bars (two months after) depict speculators’ USD positioning before, during and after hawkish FED announcements. And if you analyze the relationship, more often than not, speculators buy the U.S. dollar in anticipation, hold throughout the event and then bail after the drama unfolds. As further evidence, if you turn to the chart on the right, you can see that leveraged funds are notorious for front-running the FED’s actions. With eight weeks preceding major FED events often resulting in significant increases in net-long positioning, leveraged funds aim to strike while the iron is hot. The bottom line? With the Jackson Hole Economic Policy Symposium scheduled for Aug. 26-28 (roughly six weeks away), another front-run could already be underway.
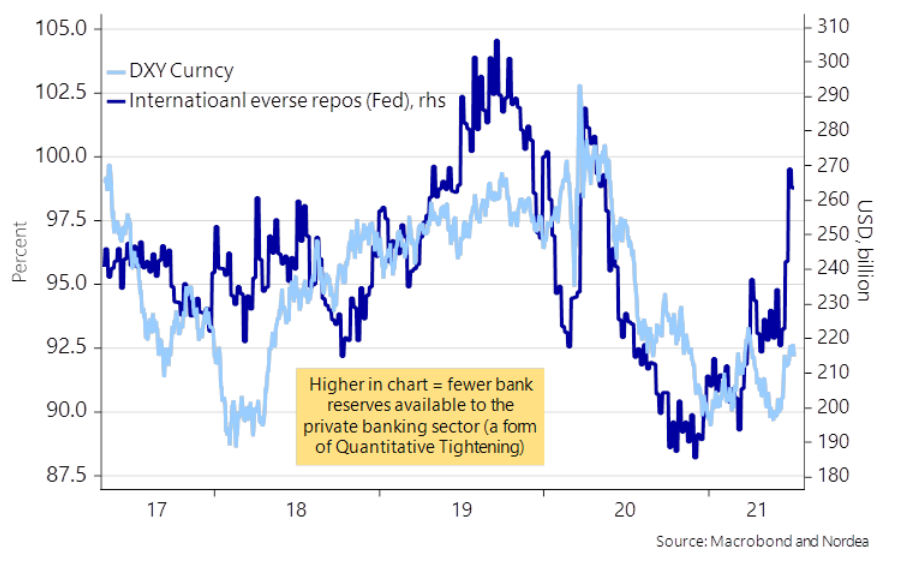
Finally, while I’ve been warning for some time that the FED’s daily reverse repurchase agreements are the fundamental equivalent of a shadow taper (though, it doesn’t have the same psychological effect), the FED sold $776.261 billion worth of reverse repos on Jul. 15 and $859.975 billion worth of reverse repos on Jul. 14. More importantly, though, with the U.S. 10-Year Treasury yield often moving inversely of the FED’s international reverse repos, bond investors are behaving as if the taper is already underway.
Please see below:
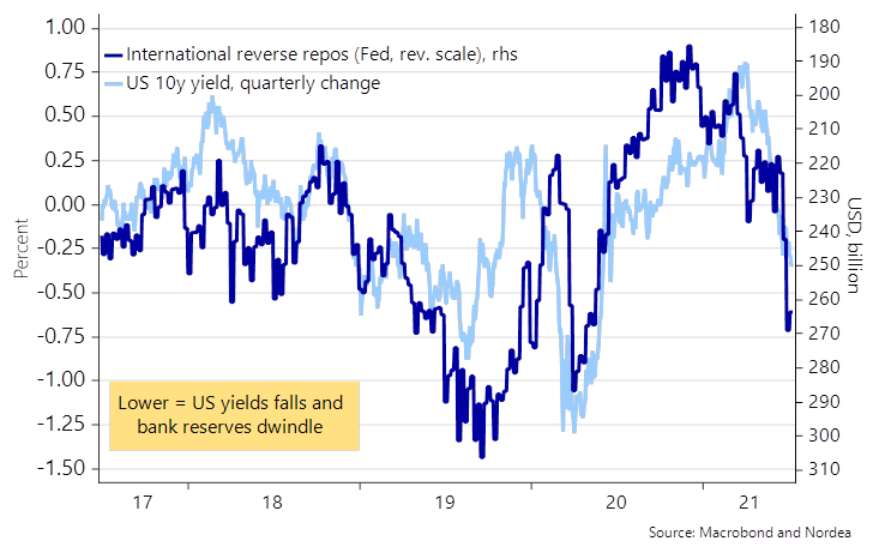
To explain, the dark blue line above tracks the quarterly percentage change in the U.S. 10-Year Treasury yield, while the light blue line above tracks the FED’s inverted (scale flipped upside down) international reverse repos. If you analyze the relationship, you can see that the larger the liquidity drain, the more bond investors position for slower growth, lower inflation and a hawkish FED.
Conversely, the dynamic has the opposite effect on the USD Index. With U.S. dollars being siphoned out of the system, it’s akin to the FED reducing its QE program. As such, the liquidity drain (lower supply of dollars) is extremely bullish for the greenback.
In conclusion, while the PMs have been buoyed by falling real yields, their relative performance has been extremely subdued. From March through May, gold rallied sharply once the U.S. 10-Year real yield reversed course. This time around, however, the bounce has been tepid, as concerns over a prospective taper counters the bullish optimism. As a result, with the USD Index gaining steam, inflation surging and a taper announcement likely to commence in September, the PMs’ optimism could evaporate at the drop of a dime. Thus, it’s prudent to avoid reading too much into their recent strength.
Related: How Long Can Inflation Be Transitory?
The views and opinions expressed in this article are those of the contributor, and do not represent the views of IRIS Media Works and Advisorpedia. Readers should not consider statements made by the contributor as formal recommendations and should consult their financial advisor before making any investment decisions. To read our full disclosure, please click here.