
Trending

In last week’s Technically Speaking post we discussed why we reduced risk in anticipation of a pullback in the markets. However, there are some warning signs which beg the question “is a larger correction coming?”
A Tough Start
What started out as a promising January, didn’t end up that way as markets dipped into the red for the year. More importantly, February tends to be a weak month which suggests the selling may not be over just yet. Such is particularly the case, as we will discuss momentarily, with many areas of the market technically stretched and over-valued.
As our colleagues at StockTrader’s Alamanac point out:
“Devised by Yale Hirsch in 1972, the January Barometer has registered eleven major errors since 1950 for an 84.5% accuracy ratio. This indicator adheres to the propensity that as the S&P 500 goes in January, so goes the year. Of the eleven major errors, Vietnam affected 1966 and 1968. 1982 saw the start of a major bull market in August. Two January rate cuts and 9/11 affected 2001. The market in January 2003 was held down by the anticipation of military action in Iraq. The second worst bear market since 1900 ended in March of 2009 and Federal Reserve intervention influenced 2010 and 2014. In 2016, DJIA slipped into an official Ned Davis bear market in January. The eleventh major error was last year, 2020. Including the eight flat years yields a .732 batting average.
The near-term outlook for the market has diminished as every-down January since 1950 was followed by a new or continuing bear market, a 10% correction, or a flat year. However, it is challenging to envision a full-blown bear market with the Fed keeping a close eye on the market and the new administration working on additional fiscal stimulus.”
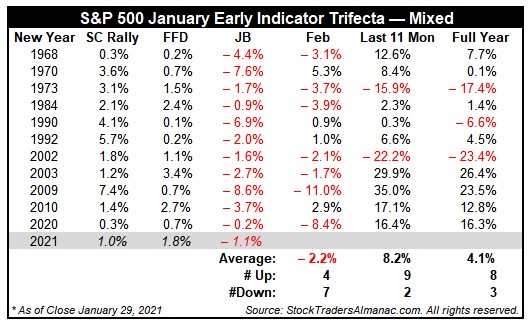
Read Jeff’s comments carefully. Excluding the 11-major “errors,” in the table above, a down January predicted a negative year 73% of the time.
Importantly, note the weakness that tends to follow in February.
Short-Term Technical Indicators
Last week’s sell-off sudden reversal may have been just a “warning shot.” As noted in this past weekend’s Real Investment Report: (For free email delivery click here)
“While I fully expect a reflexive rally next week, that will likely be an opportunity to reduce risk rather than chasing markets. Such will be the case until we see money flows start to turn positive again, suggesting some underlying buying pressure.”
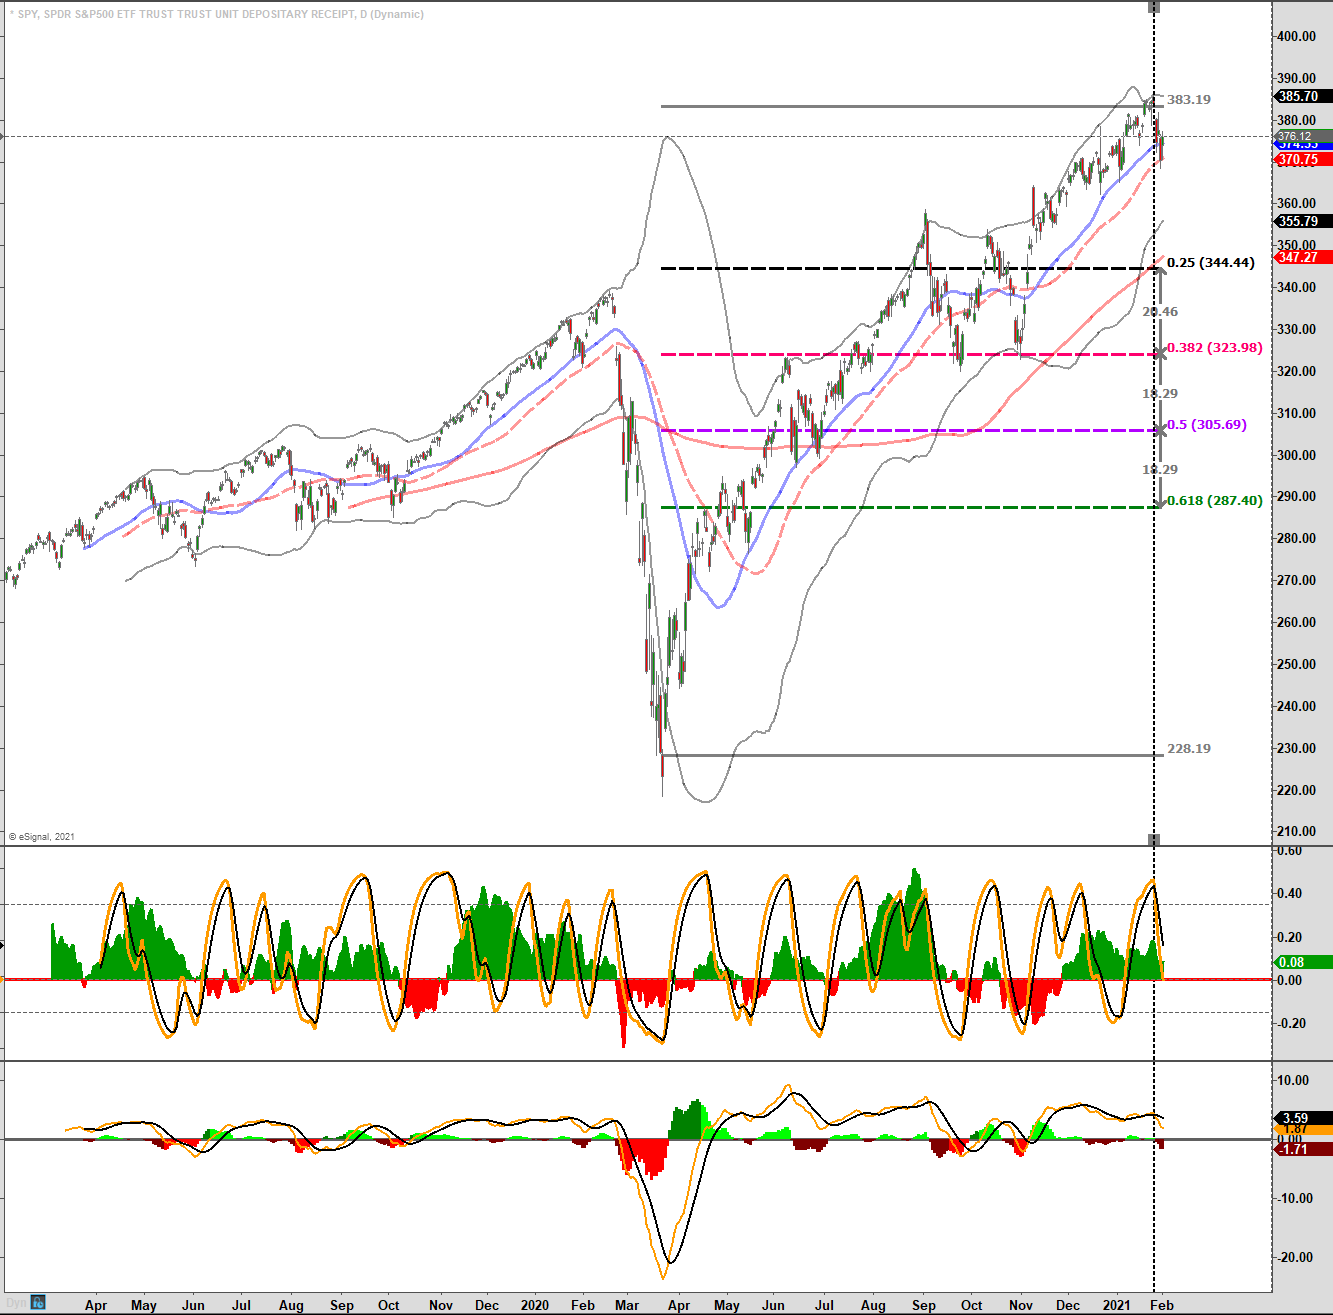
Yesterday, the market did indeed bounce as expected. However, while the market did hold support at the 50-dma, the “money flows,” in the middle-panel, are still weak with a “sell signal” currently in place.
There are certainly many factors at play that could indeed reverse the markets in the short-term. As noted by Stocktrader’s Almanac above, the Federal Reserve is still keeping rates at zero and buying $120 billion in bonds every month. That liquidity has clearly, as noted by the rally from the March lows, showed up increased market speculation.
The chart below shows the weekly “positive net changes” to the Fed’s balance sheet. Not surprisingly, the Fed has increased their bond purchases whenever the market has weakened.
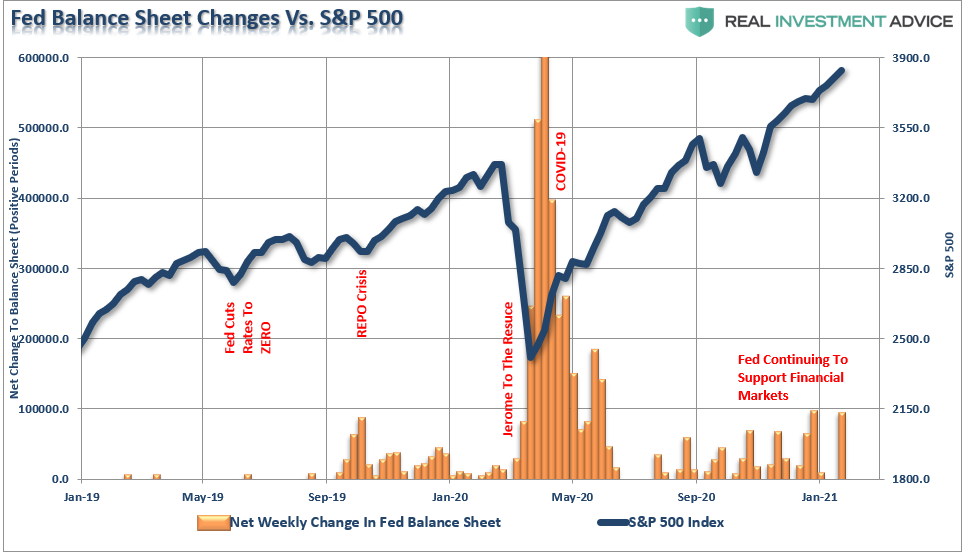
Of course, with inflationary pressures showing up throughout the economic system, there is a risk the Fed may become trapped by their own mandates of price stability.
A Word About Corrections
Before we go further with our analysis, it is important to discuss to distinguish the difference between a “correction” and a “bear market.”
A “bear market,” which is not simply a 20% correction, is when the “price trends” of the market change from a generally rising to falling trend over an extended period. The chart below puts bull and bear markets into better context.

A “correction” is a very short period where prices reverse to some previous level of support but maintain the previous rising trend of prices.
The next sentence is the most important.
A “correction” can be accomplished by either:
- A decline in price to a previous level of support, OR
- A consolidation process whereby the market trades within a defined range long enough to resolve previous overbought or extended conditions.
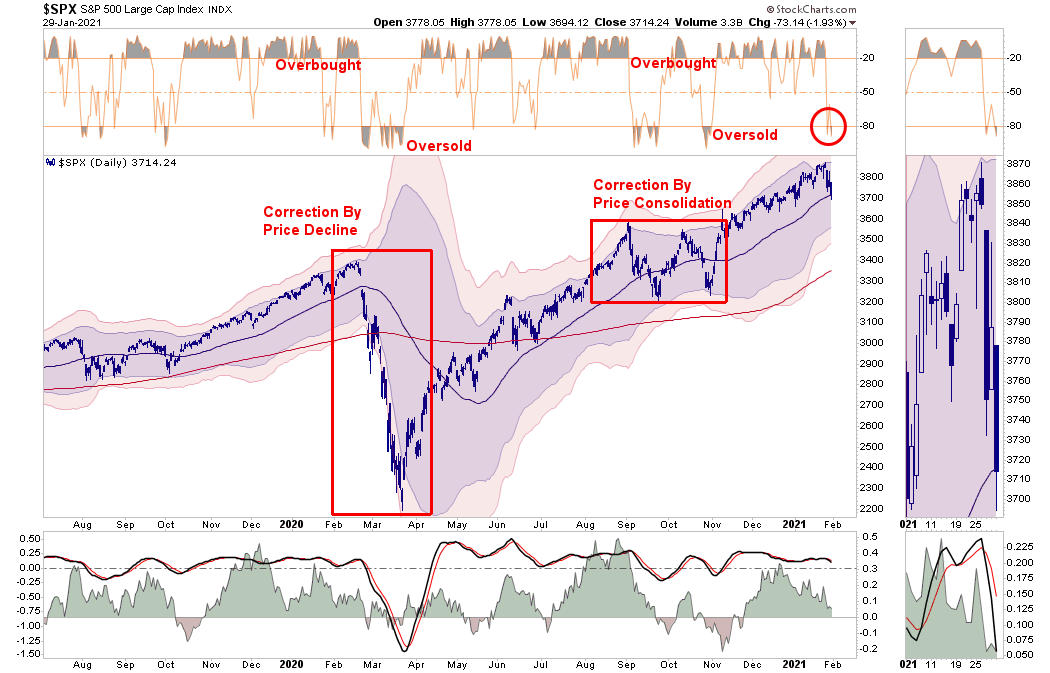
The differentiation is important.
On a short-term basis, as noted in the first chart above, indicators can swing fairly quickly between overbought and oversold and generally result in “corrections by consolidation.”
However, over the intermediate-term, the indicators tend to denote larger “corrections by declines in price.”
Intermediate Indicators Worrisome
With that understanding, if we look at our intermediate-term indicators (using weekly data), the picture becomes more concerning.
Again, focus on the middle panel of “money flows.” Despite the “seeming” exuberance of the market over the last few months, money flows have continued to weaken.
In early November, we recommended increasing equity exposure to portfolios as the “buy signal” was triggered. Last week, we are now very close to registering a “sell signal” which historically suggests a deeper correction or consolidation may be in progress.
While the market could indeed bounce in the short-term, the decline in “money flows,” and the convergence of “sell signals,” does increase our concern of a bigger decline over the next month or so.
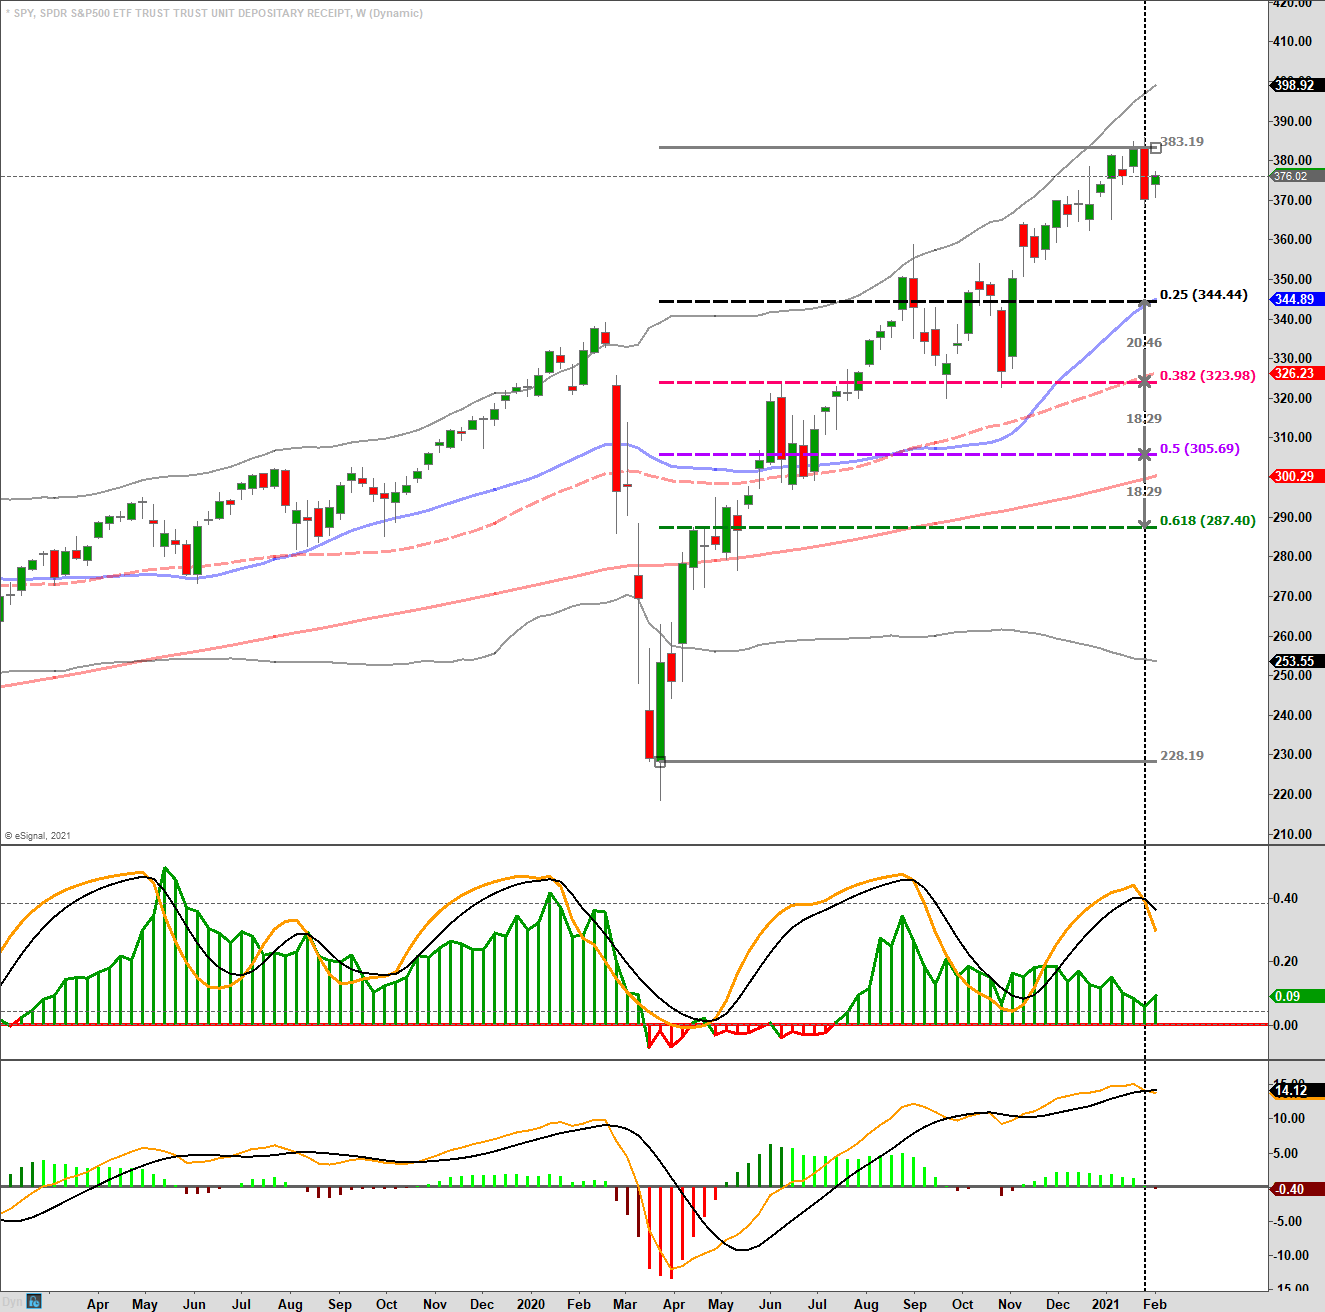
I added some Fibonacci retracement levels which also tend to align with more important moving average levels of support. The first level of important support is the one-year moving average (blue line) which coincides with a 25% retracement of the rally from the March lows. As of Friday’s close, (as we are using weekly data), such would entail a 10% decline from the recent highs.
Such a correction is well within the norms of any given year of the market. Deeper corrections are certainly possible if something “spooks” the market, however, we will currently concentrate on our short-term risks in terms of risk management.
Longer-Term Concerns
One of the more concerning charts we have been monitoring for some time is the monthly expanding price pattern. Once again, the market has struggled with the top of the expanding pattern as relative strength continues to deteriorate. With the markets extremely extended on a monthly basis, as denoted by the red arrows, such periods have had less positive outcomes for investors.
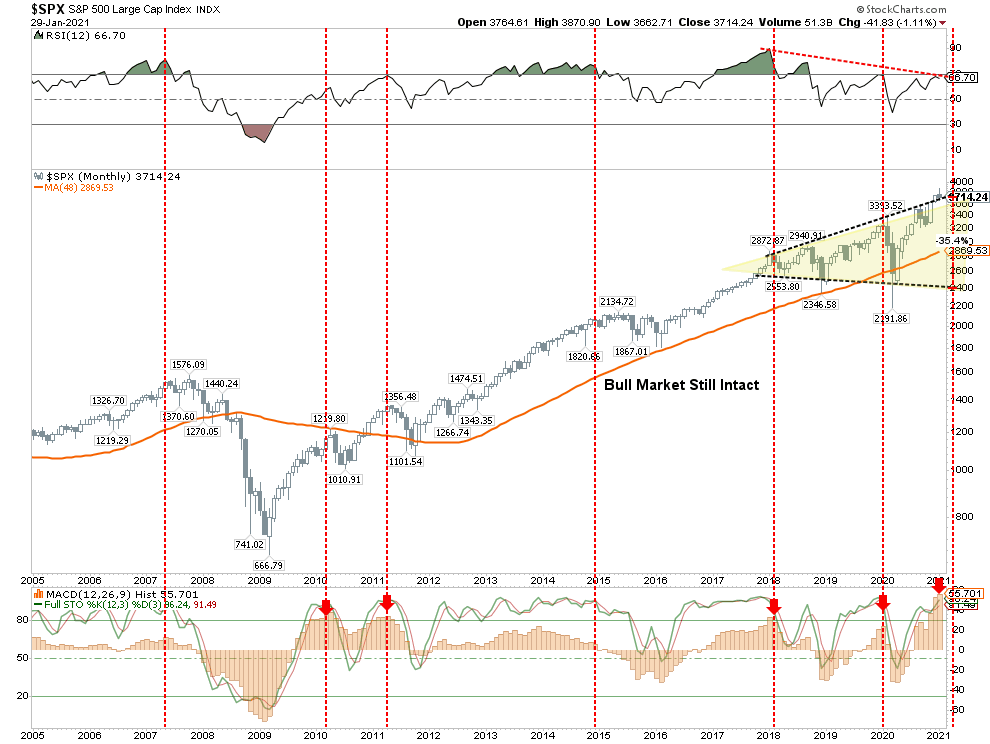
Monthly price charts are NOT TO BE USED for trading portfolios. Indications are only valid at the end of the month, and they are slow to turn.
Due to the lag, most short-term focused investors make assumptions the indications are “wrong” this time. However, history tends to prove that extreme market extensions rarely resolve themselves to the upside.
Of course, what causes the eventual “reversion” is always an unexpected, exogenous event when sends investors scrambling for exits where there are few buyers.
As noted this past weekend, while everyone was focused on vaccines and more stimulus, the “Reddit Riot” has the potential to upend markets.
The Reddit Riot
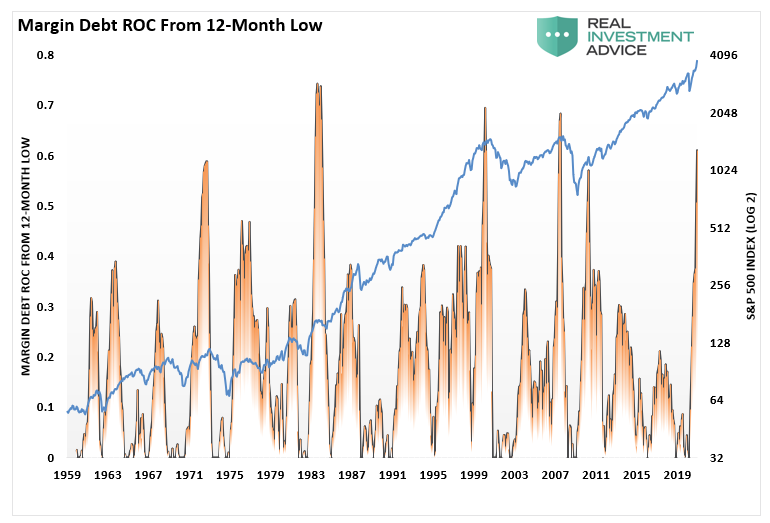
We have discussed the issue with surging margin debt previously, however, this is a specific risk related to the run on stocks like Gamestop and AMC Theatres.
Without getting into all the details of how “margin lines” works, the basic issue is that brokerage firms take on “credit risk,” by extended margin loans to clients. Here is the important part, there are two types of brokerage accounts: Type 1: Cash and Type 2: Margin. If accounts are designated as Type 2, whether or not there is a margin loan outstanding, it requires that firms maintain a 10% collateral requirement of “cash” on their books.
Normally this isn’t an issue. However, since October, investors have been taking on massive levels of margin debt to leverage up their exposure to stocks.
In turn, the massive increase in margin loans has pushed negative cash balances to record levels.
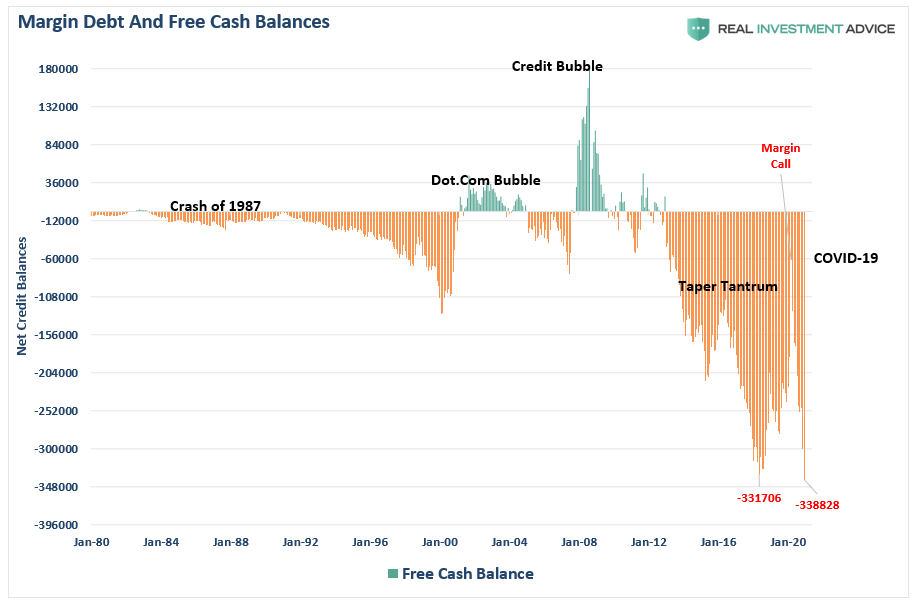
While there was much angst in the media last week by firms restricting purchases of stocks that were skyrocketing due to the ongoing “short-squeeze,” those restrictions were due to a lack of sufficient collateral by firms to meet regulatory requirements.
If these short-squeezes continue or indeed worsen, there is a not so inconsequential risk that one or more firms could wind up in a financial meltdown.
As is always the case, leverage is the fuel that drives asset prices higher. It is also the fuel that “burns the house down” when things go in the wrong direction. It is also one of those things the Federal Reserve may have a difficult time trying to bail out.
Continue To Focus On Risk Controls
As noted above, we will likely get a rally as early as next week. However, it is likely we should consider using any rally to remove excess risk until the technical backdrop improves.
Here are the guidelines we recommend for adjusting your portfolio risk:
Step 1) Clean Up Your Portfolio
- Tighten up stop-loss levels to current support levels for each position.
- Take profits in positions that have been big winners
- Sell laggards and losers
- Raise cash and rebalance portfolios to target weightings.
Step 2) Compare Your Portfolio Allocation To Your Model Allocation.
- Determine areas requiring new or increased exposure.
- Calculate how many shares need to be purchased to fill allocation requirements.
- Evaluate cash requirements to make needed purchases.
- Re-examine portfolio to rebalance and raise sufficient cash for requirements.
- Determine entry price levels for each new position.
- Establish “stop-loss” levels for each position.
- Calculate “sell/profit taking” levels for each position.
(Note: the primary rule of investing that should NEVER be broken is: “Never invest money without knowing where you are going to sell if you are wrong, and if you are right.”)
Step 3) Have positions ready to execute accordingly given the proper market set up. In this case, we are adjusting exposure to areas we like now, and using the rally to reduce/remove the sectors where risk is most prevalent.
Stay alert, things are finally getting interesting.