Is there a bear market lurking in the shadows?
Such seems to be the question everyone is asking me as of late. Over the last couple of weeks, we have reviewed the bullish and bearish cases for the market.
- Sentiment Is So Bearish. It’s Bullish
- Bullish Or Bearish? Where Are We Now?
- Bear Squeeze Or The Return Of The Bull?
In those discussions, I tried to balance the bullish and bearish arguments into some actionable strategies over the next few weeks. The purpose of analyzing both views is to minimize confirmation bias, which can negatively impact portfolios over time.
“When investors seek out information that confirms their existing opinions and ignore facts or data that refutes them, such may skew the value of their decisions based on their own cognitive biases. This psychological phenomenon occurs when investors filter out potentially useful facts and opinions that don’t coincide with their preconceived notions.” – Investopedia
While analyzing the shorter-term probabilities of a further advance or decline, the case for a more significant lurking bear market within the next 18-months solidified. Such is the context of today’s post.
The Risk Of Prognostications
However, there are a few disclaimers before we dig into the technical and fundamental concerns.
- Longer-term timing is always challenging to pin down.
- We base assumptions on the current environment remaining status quo. (If the Fed reverses into QE and cuts rates to zero, then the analysis is no longer viable)
- Long-range assumptions do not mean selling everything and going to cash today. (That is not portfolio or risk management, and such actions can have very negative consequences if something changes.}
- Lastly, long-range predictions are not reliable statements of fact. They are assumptions based on analyzing the possibilities and probabilities of historical data. Every period is different.
In other words, take the analysis below with a “grain of salt.” For us, the analysis alerts us to things we need to focus on to protect client capital. However, as Nobel laureate Dr. Paul Samuelson once quipped:
“Well, when events change, I change my mind. What do you do?”
That is a striking statement as things can and almost always do change. Such is particularly the case with more “bearish” outlooks as the more dire prognostications rarely happen.
Let’s examine some of the issues suggesting the risk of a continued bear market cycle ahead.
The Fundamental Problem Of Tighter Policy
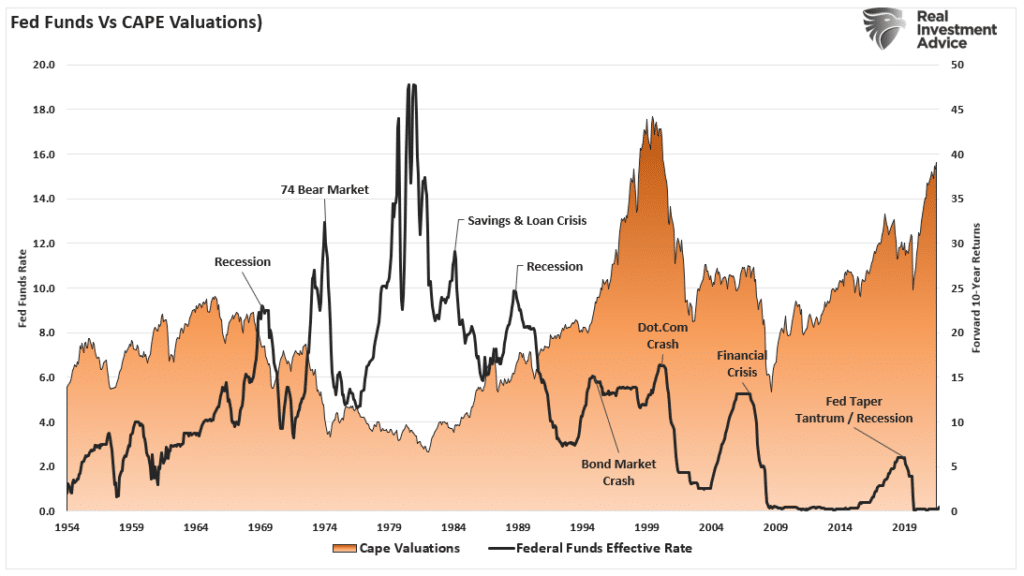
From the fundamental view, we have previously noted the numerous challenges for the market over the next several months. Most notable, of course, is the concern of overvaluation and corporate earnings. As the Federal Reserve engages in a more aggressive rate hiking cycle and balance sheet reduction program, the previous supports get removed.
In 2008, 2000, and 1929, stock valuations were incredibly high. Due to the long preceding bull market cycle, it was widely believed “this time was different.” Ultimately, it wasn’t. Since 2009, the belief that “low-interest rates justify high valuations” was the primary catalyst supporting the “this time is different” narrative. However, with interest rates now rising, the support for overvaluation is at risk. Historically, the Federal Reserve hikes rates until “something breaks,” which resolves the overvaluation problem. (i.e., prices fall sharply.)
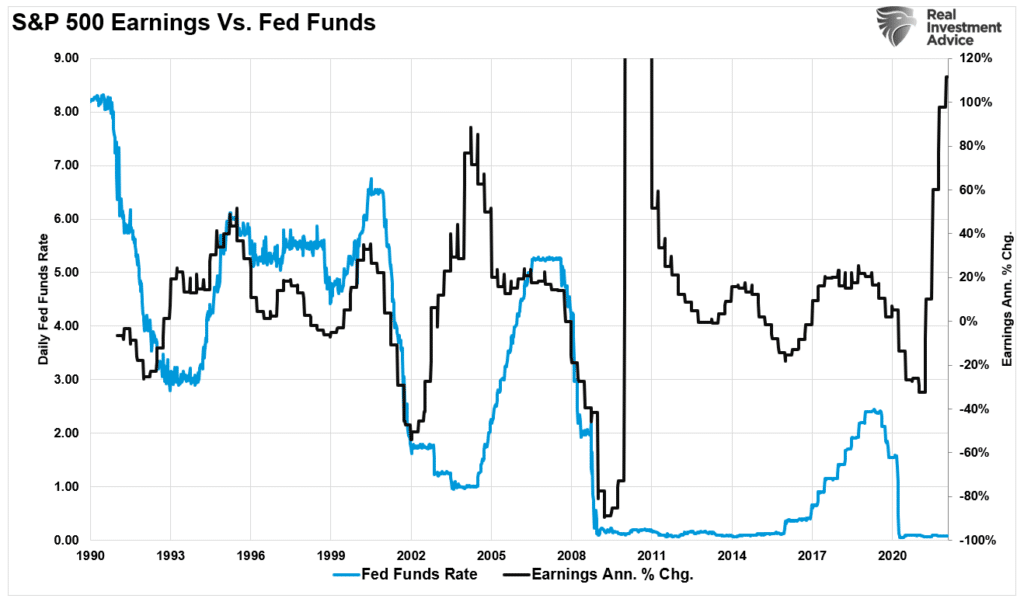
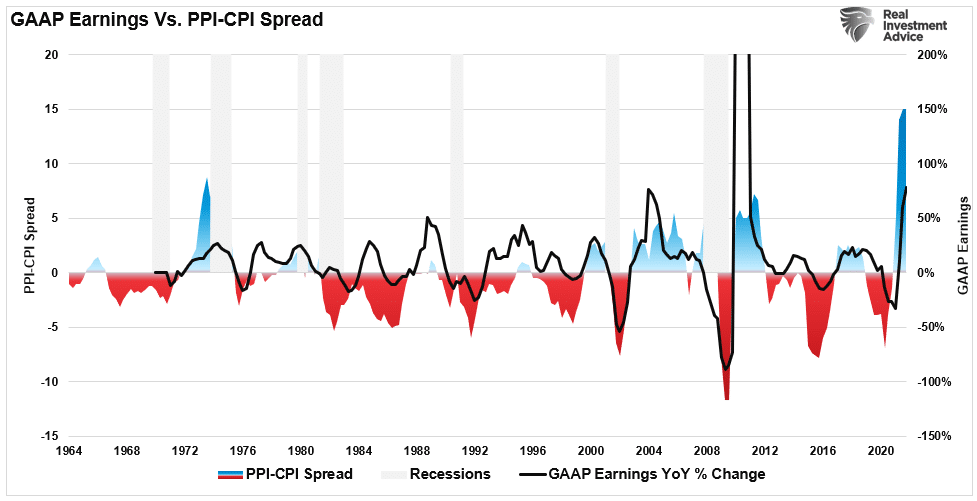
Secondarily, corporate earnings estimates remain elevated as we head into a monetary tightening campaign. As noted in “An Earnings Reversion,” tighter Fed policy and surging input costs will put earnings at risk. Such will make high valuation even more challenging to justify.
“The whole point of the Fed hiking rates is to slow economic growth, thereby reducing inflation. Unfortunately, with the economy already slowing, additional tightening could exacerbate the risk of an economic contraction, given the dependence on low rates to support economic growth. Given that earnings are highly correlated to economic growth, earnings don’t survive rate hikes.”
Furthermore, surging input costs are becoming more difficult to pass to consumers. Such suggests companies will absorb the input costs they can’t pass on to consumers. Eventually, that absorption of costs impairs profitability.
The Technical Warnings Increasing
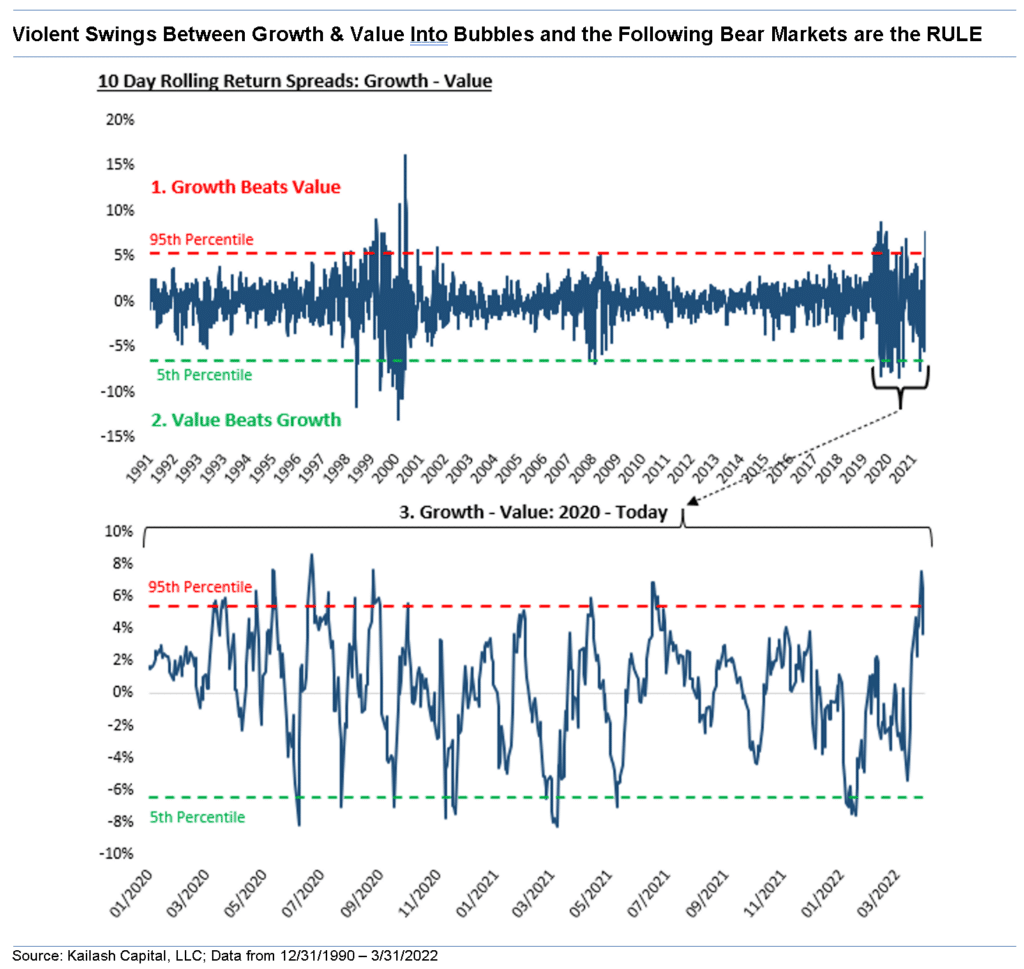
One of the more difficult challenges in 2022 remains the navigation of the rapid swings between growth and value. However, as Kailash Concepts recently noted, those rapid swings precede “bear markets.” To wit:
“A very popular narrative over the last few years has been that fundamentals no longer work. That’s always the story at market peaks.
The chart below takes that ending stretch from January 2020 through today and expands it to make it easier to see. Look at the violent horse-trading between growth and value. Lots of 10 day stretches where growth beats value by 6% or more and value beats growth by 6% or more. This behavior is not consistent with the price patterns we see at the bottom of a bear market. The market bottoms in 2003 and 2009 were characterized by much less “warfare” between the two groups.”
The last period where value and growth consistently traded 6% blows every 10-days was between 1998 and 2001.
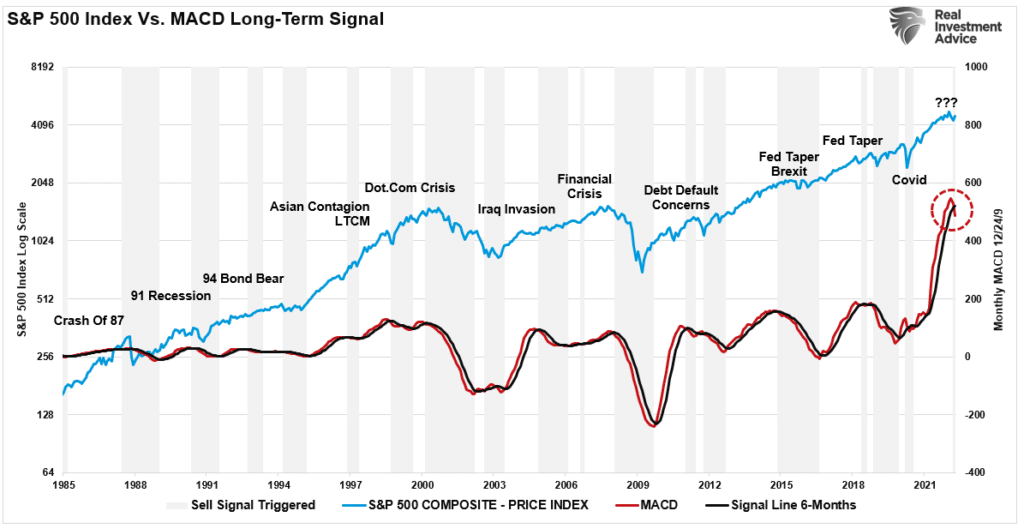
Lastly, from a purely technical perspective, the monthly moving average convergence divergence indicator (MACD) also rings a significant warning bell. The chart below measures the difference between the 12 and 24-month moving averages. When that line crosses below the 6-month signal line, such suggests the market is at risk.
Notably, after the massive infusions of capital into the financial markets following the pandemic, the MACD line surged to levels never before seen historically. Such suggests an eventual reversion will be similarly dramatic. The shaded grey bars show when a previous sell signal got triggered. While there are certainly some false signals along the way, it is worth noting that many of the sell signals are closely associated with more critical market-related events, corrections, and bear markets.
Failing To Plan
Does the current sell signal mean a bear market is lurking?
No. Given this indicator is based on monthly data, it can take quite some time for an event to play out. As such, it will get perceived the indicator is wrong this time. However, as noted above, if everything remains status quo, it likely won’t be.
But, if the Fed reverses course, starts lowering rates, reintroducing QE, and repurchasing junk bonds, then such would like arrest any approaching downturn at least temporarily. Such is what history has taught us.
In Bullish Or Bearish, we provided some simple guidelines to follow:
- Tighten up stop-loss levels to current support levels for each position. (Provides identifiable exit points when the market reverses.)
- Hedge portfolios against significant market declines. (Non-correlated assets, short-market positions, index put options, bonds.)
- Take profits in positions that have been big winners (Rebalancing overbought or extended positions to capture gains but continue participating in the advance.)
- Sell laggards and losers. (If something isn’t working in a market melt-up, it most likely won’t work during a broad decline. Better to eliminate the risk early.)
- Raise cash and rebalance portfolios to target weightings. (Rebalancing risk regularly keeps hidden risks somewhat mitigated.)
Notice, nothing in there says, “sell everything and go to cash.”
Given the weight of evidence currently at hand, it certainly doesn’t hurt to plan and even take some actions to prepare for a storm if, or when, it comes.
If the environment changes, it’s a simple process to reallocate aggressively to equities. By planning, the worst that can happen is underperformance if the bull market suddenly resumes.
But failing to plan entirely is the best way to fail completely if the lurking bear market awakens.
Related:


