
Trending

S&P 500 X-Ray: a primer, using today's market
Risk ranges for risk-managed investing
If I’ve said it once, I’ve said it a thousand times: investment management IS risk management.
Look no further than the past 2 years in the stock market. Through yesterday’s close, the SPY (S&P 500) ETF is up a whopping 20% this year. And QQQ (Nasdaq 100 ETF) is up 47% this year. Putting aside the fact that EQAL (the average stock within the 1,000 largest companies) is only up 3% for the year, the “headline” indexes are flying. What a stock market, eh?
Ah, but how quickly we forget 2022. And that counts too. SPY and QQQ were down so much last year, their surges in 2023 bring their gains since the start of last year to…wait for it…a LOSS of about 1% each.
The takeaway: if we don’t prioritize managing investment risk, many victories will feel quite empty. Sort of like a baseball team that wins their last game of the season, but finishes with a record of 81 wins and 81 losses. A short-term high that simply gets you even, and not to the playoffs.
In investing the past 2 years have been rough all around: most of the stock market and the bond market have been red ink. Even for those who benefitted from the S&P 500’s strong reliance on a small number of stocks to produce those gains, I’d summarize it this way:
One person’s year-to-date gain is another person’s 2 years wasted!
By no means am I saying that anyone up 20% or 40% this year should be unhappy. I’m just arguing for putting it in context. If you managed risk throughout last year and this year, you were better off than the S&P 500 or Nasdaq 100 investor in 2 ways:
- You probably made a profit instead of breaking even
- You were never tempted to let emotions enter your investment process
Because for every person I’ve met who says “I’m a long-term investor” and really means it, there are 10 people who are excellent candidates to panic once they are down 10%, 20%, 30%, etc. One great way to avoid that from happening…is to not let it happen!
At ETFYourself.com, we have unleashed many of the risk management and perspective-aiding tools I’ve used to manage money professionally since the 1990s. I’m the first to tell you that 40% up years are a long shot for my style. I think I had one about 20 years ago, but I’d have to check.
But when it comes to “living to fight another day, week, month or year,” THAT is what I think is what many self-directed investors may not give enough thought to. So, we are here to be the thought leaders in risk management. One way we do that is by providing and keeping current the “S&P 500 X-Ray” indicator I created a while back.
The X-Ray is our way of putting ranges around my #1 investing rule: Avoid Big Loss.
One way to do that is to perform an ongoing analysis of what I think the potential best and worst case scenarios are for the S&P 500, over 3 different time frames.
- Weeks (3-6 weeks)
- Months (3-9 months)
- Years (1-3 years)
Naturally, this is not an exact science, and the science is less precise the longer we look out in time. Still, I prefer “time-stamping” my assessment of reward and risk on a regular basis. It is part of the disclipline I think any serious investor needs to have. We invite you to learn from my examples in this area and develop your own method, or simply follow along with my approach.
That’s your call. I just hope your response is to do one or the other, not simply ignore risk management as a top priority.
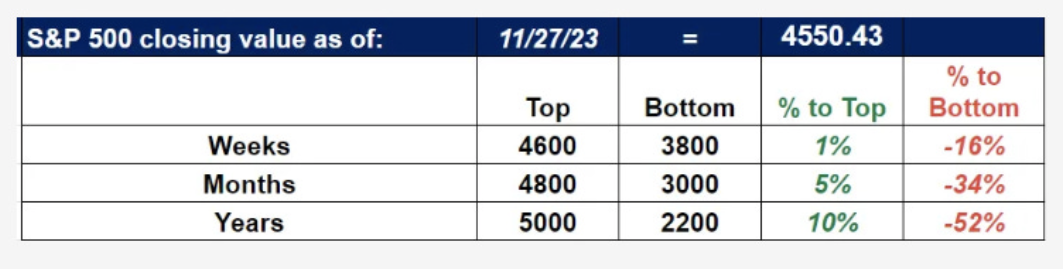
Here’s what the S&P X-Ray looked like as of our weekly letter last week:
And, here’s what it looked like during the last week of 2021 (12/29/21), with the S&P 500 level at 4,793.
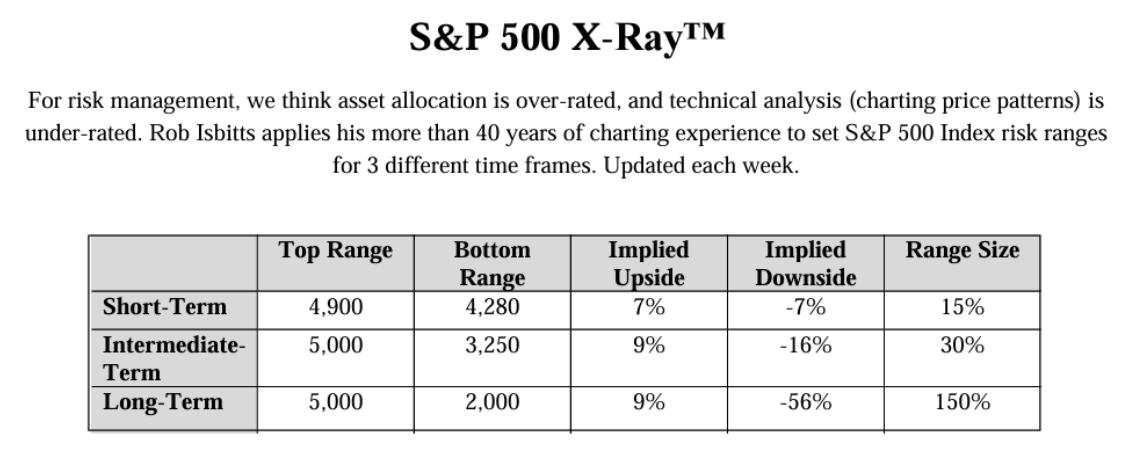
What happened in between? The S&P 500 dropped sharply to start 2022, and hit the short-term range bottom in late April. So it got there, but more in line with the intermediate (3-9 months time frame).
After a period of sharp bounces followed by lower-lows, the S&P 500 dropped all the way down below 3,500 in mid-October of 2022. So, it hit the intermediate-term target in about the right time frame.
That was the market bottom in 2022, and it has held since then, rallying all the way up to 4,200, then busting higher, and settling into its current range of 4,200 to 4,600, which it has been trapped in for the past 6 months.
If you look back at the first table (the current X-Ray), you see that the 4,600 is the top of the short-term (weeks) range. I won’t adjust that unless/until it breaks through there with what looks like a sustainable move. If so, then 4,800 (which would be a complete return to where it started 2022) and perhaps to 5,000 are more possible. The downside is still the one of bigger magnitude to me, as you can see in the current X-Ray.
The most important part of this tool in my opinion is NOT the ranges themselves. It is the green and red columns on the right of the current X-Ray table format.
The ranges are simply my best guesstimate at any point in time, based on 43 years of chart-reading. I am one of many investment strategists attempting to do the same thing, using charts or fundamental or valuation analysis, or even the lunar calendar (seriously, that’s a thing!). We all have our own unique methods, and we all have times where we “nail it” and other times where we don’t.
I decided a long time ago that being part of that “meat market” was not good for anyone, especially my audience. What WAS good for them was this:
- Maintain and adjust the ranges, BUT…
- Use the 2 rightmost columns (green and red) to gauge the TRADEOFF between reward potential and potential for major loss. Nothing sums up my approach to investing, risk management and portfolio management more than those 2 columns, especially the months column.
- How good could it get the next 3-9 months? I can see 5% upside but as much as 34% downside. You don’t need to be precise here. The message, converted to “caveman” if you will: risk big, reward small. That’s a main reason why I prefer the “gift” of high T-bill rates, and am willing to take only a modest amount of risk in equities, or in long-term bonds right now.
- What can change that? Not the news headlines. The only thing that matters in the end: price! Sure, the news and fundamentals, etc., will drive that to some extent. But I’m in “show me” mode for the upside until price, not some investment guru (on TV or X or Instagram), says so. If the market is stronger than I expect, I’ll change when the facts do. If this is like late 1999/early 2000, that green column will show higher numbers soon, because I’ll adjust them. If it is more like late 2021, that won’t be on the table, and the numbers will look very realistic.
So, that’s the S&P 500 X-Ray, and more importantly, HOW TO USE it.
Our first “Ask Me Anything” session was awesome, and there was one excellent question on the X-Ray. I have a list of topics to cover in upcoming live sessions, and I welcome your suggestions about what you want me to discuss, in addition to taking your questions about the markets, the service, the tools, or anything else I can do to make you a smarter, more confident investor.
Related: Don’t Trust the S&P 500 Over 4,500!