Summary:
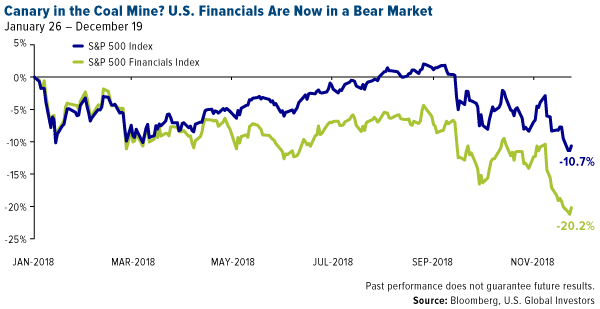
Anticipating trouble ahead, fund managers make a historic rotation out of equities into bonds. Gold and gold mining stocks have been the one bright spot this quarter. Tax reform turns one year old. Has it achieved what was expected?Disregarding strong opposition from the likes of DoubleLine Capital founder Jeffrey Gundlach, legendary hedge fund manager Stanley Druckenmiller, “Mad Money” host Jim Cramer, President Donald Trump and others, Federal Reserve Chairman Jerome Powell hiked rates last Wednesday for the fourth time in 2018.Markets responded negatively, with the Dow Jones Industrial Average jumping around in a nearly 890-point range before closing at its lowest level in more than a year. By the end of the week, both the small-cap Russell 2000 Index and tech-heavy Nasdaq Composite Index had entered a bear market, while the S&P 500 Index was on track for not only its worst year since 2008, but also its worst month since 1931.Among the sectors now in a bear market is financials, down around 20 percent since its peak in January. Regional banks, as measured by the KBW Regional Bank Index, have been banged up even worse, having fallen close to 30 percent since their all-time high in early June.
 click to enlarge
I bring up financials here because the sector is sometimes considered to be the “canary in the coal mine,” for the very good reason that financial institutions are highly exposed to
the performance of the broader market.What’s more, we learned last week that lenders are starting to pull back from riskier loans, a sign that they’re getting more cautious as recession fears loom. According to the New York Fed, the credit card rejection rate in October climbed to 21.2 percent, well above the year-ago rate of 15.7 percent. Banks also cut off credit from 7 percent of customers, the highest rate since 2013.
Fund Managers De-Risk in Favor of Bonds and Cash
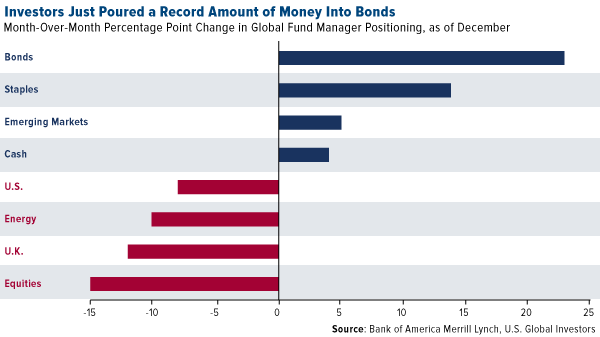
Against this backdrop, fund managers have turned incredibly bearish on risk assets and bullish on defensive positions such as bonds, staples and cash. According to Zero Hedge’s analysis of a Bank of America Merrill Lynch report, this December represents “the biggest ever one-month rotation into bonds class as investors dumped equities around the globe while bond allocations rose 23 percentage points to net 35 percent underweight.” Fund managers’ average cash levels stood at 4.7 percent in November, above the 10-year average, according to Morningstar data.
 click to enlarge
Equity outflows have been particularly pronounced. Lipper data shows that, in the week ended December 13, as much as $46 billion fled U.S. stock mutual funds and ETFs. That’s the most ever for a one-week period. It’s very possible that the selling is related to end-of-year tax-loss harvesting, but again, we’ve never seen outflows of this magnitude.As such, I highly encourage investors to heed the recent advice from Goldman Sachs: Get defensive by positioning yourself in “high-quality” stocks. This probably isn’t the time to speculate.
Gold Has Been the One Bright Spot
I would also recommend gold and gold stocks. The yellow metal, as expected, is performing well at the moment, and commodity traders have taken a net bullish position for the first time since July. So far this quarter, gold has crushed the market, returning around 6 percent as of December 21, compared to negative 15 percent for the S&P 500 Index. Gold miners, though, as measured by the NYSE Arca Gold Miners Index, have been the top performer, climbing a phenomenal 12.3 percent.
 click to enlarge
On a recent episode of
“Mad Money,” Jim Cramer aired his frustration with the Fed’s decision to move ahead with another rate hike, predicting that the central bank will “have to reverse course, maybe in the next four months.” When and if that happens, “you’ll regret selling because the market will rebound so fast.”But in the meantime, Cramer says, investors should consider buying into the “bull market” in gold. He added that he likes Randgold Resources.You can read more of my thoughts on gold and gold mining stocks by
clicking here. Is It Time for the Fed to Take a Breather?
Although there’s more to the selloff than higher interest rates, industry leaders have been quick to point fingers at the Fed’s long-term accommodative policy. Speaking to CNBC last week,
Jeffrey Gundlachcommented that the problem isn’t so much that the Fed is currently hiking rates. The problem, he says, “is that the Fed shouldn’t have kept them so low for so long.”Stanley Druckenmiller made a similar argument, writing in a
Wall Street Journal op-ed that, in a best-case scenario, “the Fed would have stopped [quantitative easing] in 2010” when the recession ended. Doing so, he says, would have helped mitigate a number of problems, including “asset-price inflation, a government-debt explosion, a boom in covenant-free corporate debt and unearned-wealth inequality.” Too late now.Other analysts have highlighted the untimeliness of this month’s rate hike. According to
Bloomberg’s Lu Wang, rate hikes are “exceedingly rare” when “stocks are behaving this badly.” Not since 1994, Lu says, has the Fed decided to tighten in such a volatile market. Nor has it ever tightened like this when the budget deficit was expanding, as it is right now. (I’ll have more to say on the deficit later.)Then again, there’s a case to be made that, should another recession strike, the Fed needs the ammunition to stanch further losses. If it doesn’t hike now, it won’t have the option to lower rates later. That’s the argument made by
Axios’ Felix Salmon, who believes “the only way to prevent another catastrophic asset bubble is to allow interest rates to revert to something much more normal.”
 click to enlarge
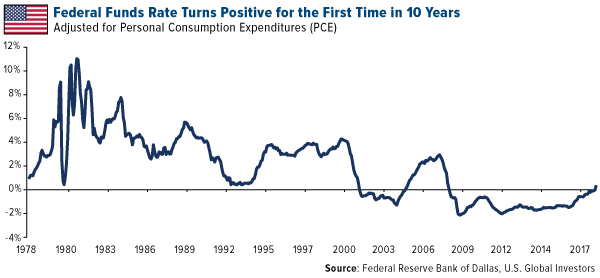
Salmon points out that, when adjusted for personal consumption expenditures (PCE)—the Fed’s preferred measure of inflation—the federal funds rate is now positive for the first time in over a decade. That’s “something to be welcomed,” he says.Related:
The Gold Bulls Just Regained the Upper Hand Deficit Is “Unprecedented” in Such a Strong Economy
There are other worrisome economic signs, including the ballooning deficit. I was surprised to learn last week that, outside of a war or recession, the U.S. deficit has never been as high as it is now. That’s according to the
Committee for a Responsible Federal Budget (CRFB), which reports that the budget deficit in 2018 is projected to total around $970 billion, up more than 45 percent from $666 billion last year.“This borrowing,” says the CRFB, “is virtually unprecedented in current economic conditions.”Normally, deficits expand during recessions and shrink during times of economic growth. But because of increased entitlement spending and other obligations, not to mention higher debt service on interest payments, the government’s outlays are far outpacing revenues.
The Tax Cuts and Jobs Act Turns One Year Old
That brings me to the issue of corporate taxes. One year ago past weekend, President Trump signed into law the Tax Cuts and Jobs Act (TCJA), which, among other things, cut the corporate income tax rate from 35 percent to 21 percent. It was initially estimated that as much as $4 trillion would be repatriated back to the U.S. by multinational corporations that have long held hordes of cash overseas in more tax-friendly jurisdictions. So, has this happened?

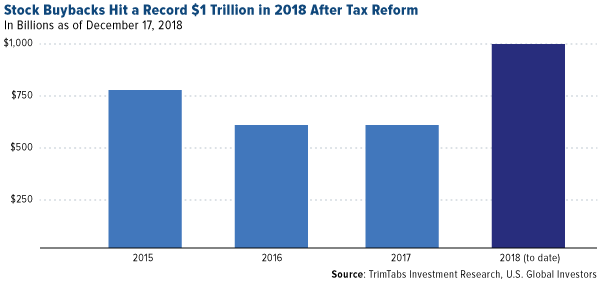
I’m pleased to see the tax law working. Companies are indeed bringing funds back, though admittedly at much lower rates than was anticipated. According to data released last week by the Commerce Department, only $92.7 billion in offshore cash was repatriated during the September quarter. That’s the lowest quarterly amount this year and 50 percent down from the second quarter. All combined, a little more than half a trillion dollars have returned to the U.S. It’s a good start, even if it falls short of expectations.Another projection was that companies would plow their tax savings back into employees, new equipment and overall expansion. Here the outcome is more mixed. Wages jumped 3.1 percent in the third quarter, the fastest rate in over a decade, which I believe can be directly attributed to the tax law.But the biggest consequence of the tax law by far has been corporations’ historic buybacks of their own stock. For the first time ever, $1 trillion was spent this year on stock repurchases. That beats the prior record of $781 billion set in 2015.
 click to enlarge
These buybacks helped stocks head higher this year—until they didn’t—but they’ve been strongly criticized for a number of reasons. One criticism is that aggressive buyback programs are often launched when stock prices are elevated, rather than when they’re on sale.With most of the S&P 500 now in a bear market, many stocks certainly look like a bargain. I would proceed with caution, however, and make sure that I’m following the
10 percent Golden Rule: 5 percent in physical gold and the other 5 percent in well-managed gold mutual fund and ETFs. Now would be a great time to rebalance.The Nasdaq Composite Index is the market capitalization-weighted index of over 3,300 common equities listed on the Nasdaq stock exchange. The Russell 2000 index is an index measuring the performance of approximately 2,000small-cap companies in the Russell 3000 Index, which is made up of 3,000 of the biggest U.S. stocks. The Russell 2000 serves as a benchmark for small-cap stocks in the United States. The KBW Regional Banking index is a modified-capitalization-weighted index, created by Keefe, Bruyette & Woods, designed to effectively represent the performance of the broad and diverse U.S. regional banking industry. The S&P 500 Index is a widely recognized capitalization-weighted index of 500 common stock prices in U.S. companies. The S&P 500 Financials Index comprises those companies included in the S&P 500 that are classified as members of the GICS financials sector. The Dow Jones Industrial Average is a price-weighted average of 30 blue chip stocks that are generally leaders in their industry. The NYSE Arca Gold Miners Index is a modified market capitalization weighted index comprised of publicly traded companies involved primarily in the mining for gold and silver. The index benchmark value was 500.0 at the close of trading on December 20, 2002.Personal consumption expenditures (PCE), or the PCE Index, measures price changes in consumer goods and services. Expenditures included in the index are actual U.S. household expenditures. Data that pertains to services, durables and non-durables are measured by the index.All opinions expressed and data provided are subject to change without notice. Some of these opinions may not be appropriate to every investor. By clicking the link(s) above, you will be directed to a third-party website(s). U.S. Global Investors does not endorse all information supplied by this/these website(s) and is not responsible for its/their content.Holdings may change daily. Holdings are reported as of the most recent quarter-end. None of the securities mentioned in the article were held by any accounts managed by U.S. Global Investors as of 09/30/2018.


 click to enlarge
  click to enlarge
  click to enlarge
  click to enlarge
  click to enlarge