
Trending

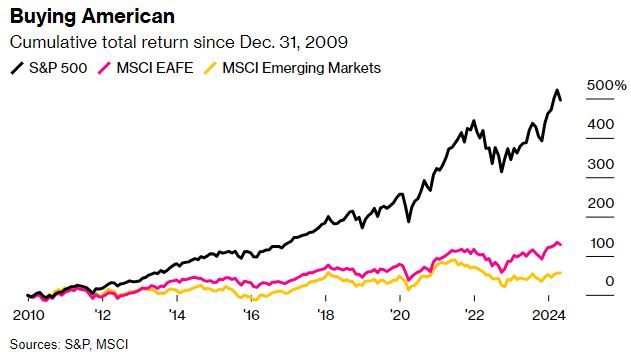
The chart below suggests that global diversification could be dead. The S&P 500 notched a total return of 13.3% annually over the past 15 years, while the MSCI EAFE and MSCI Emerging Markets indices returned 5.9% and 3.2% per annum respectively. The performance gap primarily stems from differences in earnings growth. S&P 500 earnings grew 14.1% annually over the past 15 years, while developed international and emerging markets grew earnings of 10.6% and 2.9% per annum, respectively. In addition, the global market has afforded the S&P 500 higher P/E multiples since the global financial crisis- a reflection of both more confidence and higher growth expectations.
But is Global Diversification really dead? It hasn’t worked in over a decade, but a recent Bloomberg article postulates that the lack of global diversification in the post-GFC period is an exception rather than a new norm. From 1973 to 2009, earnings growth was 5.7% annually for both EAFE and the S&P 500. Valuation multiples grew at 0.9% annually in EAFE compared to 0.5% for the S&P 500. There used to be a semblance of parity between domestic and international stocks.
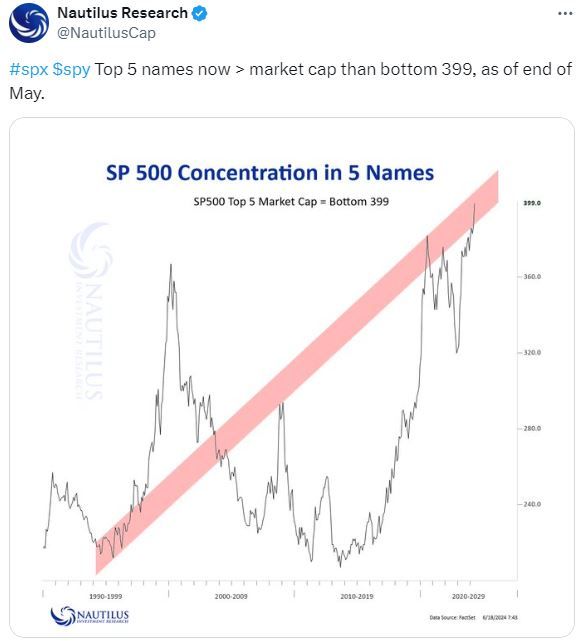
On top of that, since 2015, a handful of US companies have driven a large share of S&P 500 earnings growth. The Bloomberg Magnificent Seven Index has seen annual earnings growth of 36% since 2015, while the rest of the S&P 500 grew earnings by roughly 6% annually. Ultimately, the Author’s idea is that a mean reversion is likely. It’s certainly possible that global diversification isn’t dead, but it doesn’t mean the US is bound for underperformance. It could simply mean the S&P 500’s days of drastic outperformance are numbered.
Market Trading Update
Tuesday, the market held somewhat firm despite a retail sales report that suggests the consumer is slowing down. Furthermore, the already weak April retail sales data was revised lower. Such is not surprising given some of the recent reports from retailers like Walmart.
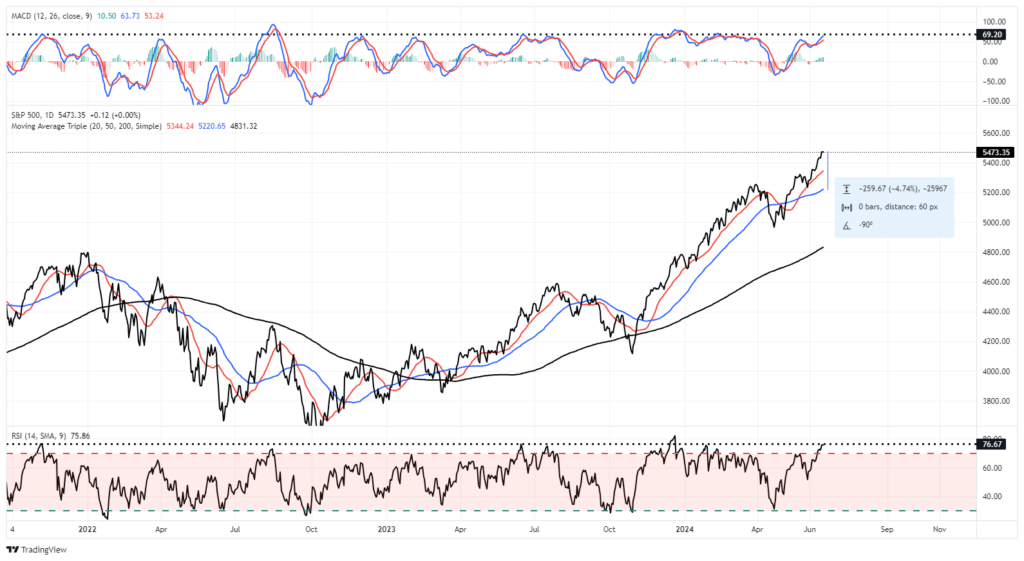
However, while weak economic data has been causing rather strong market rallies lately, increasing hope for Fed rate cuts, such was not the case yesterday. The reason is that following Monday’s rally, the market deviation from the 50-DMA is getting extreme. Furthermore, the market is very overbought, which limits the upside further. The Relative Strength Index is pushing limits that have previously marked short-term market peaks. A retracement to the 50-DMA would entail a roughly 4.5% decline, which, while not significant, will “feel” much worse given the high level of complacency. This is likely a good point to take profits, rebalance positions to target, and raise some cash as needed heading into quarter-end rebalancing.
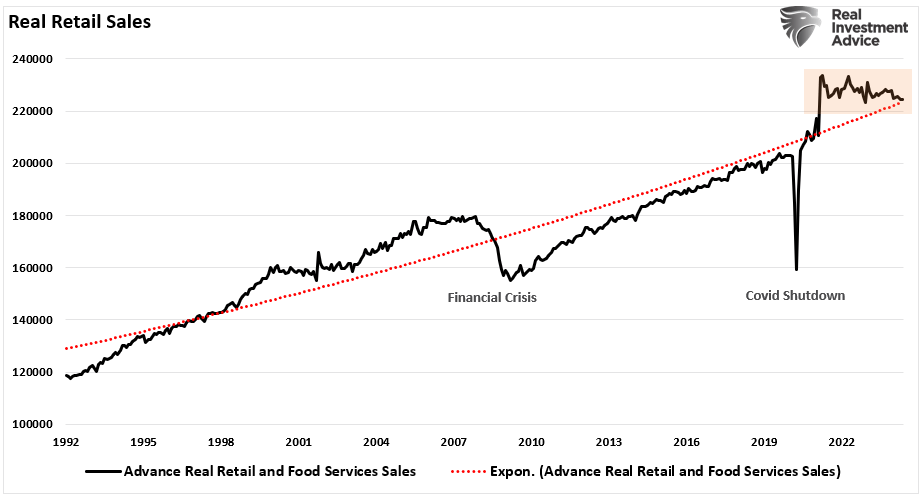
Retail Sales Disappointed in May, Price Cuts May Be on the Way
Retail sales came in weaker than expected across the board on Tuesday. Growth was 0.1% in May versus a consensus estimate of 0.2%. Excluding auto sales, retail sales dipped 1%. The control group, which feeds GDP, is now running at -0.1% on a two-month basis. After a year’s long runup in prices that has caused many to pull back on spending, analysts sense a turning point, according to a recent report in the Washington Post. This weak retail sales number adds further credence to the idea that more price cuts may be in store. The article cites several examples of price cutting by major retailers which we summarize below:
- Ford marked down its electric Mustang Mach-E by 17%.
- Target is slashing prices on 5,000 items, including Persil laundry detergent by 5%, Clorox wipes by 14% and Purina One cat food by 7%.
- Walgreens is discounting swim goggles and Squishmallows by as much as 40%.
- Ikea has lowered prices three times in the past year, while Best Buy has been marking down appliances.
- Arts and crafts chain Michaels says it’s slashing prices on 5,000 items including stickers, canvases and T-shirts.
- Several fast food chains, like McDonalds and Burger King, are offering lower-priced options.
The spate of lower prices, combined with slowing spending, suggests the economy is losing some steam after last year’s rapid momentum. That could create room for the Fed to start cutting interest rates by the end of the year. Some Wall Street economists say rate cuts could begin as early as September, especially if inflation continues its descent.
But the economy’s direction is still very much up in the air. Fresh jobs data on Friday showed that employers added 272,000 jobs in May — far more than expected — suggesting that growth is still running hot.
Mega Cap Growth Stocks Are Stretched
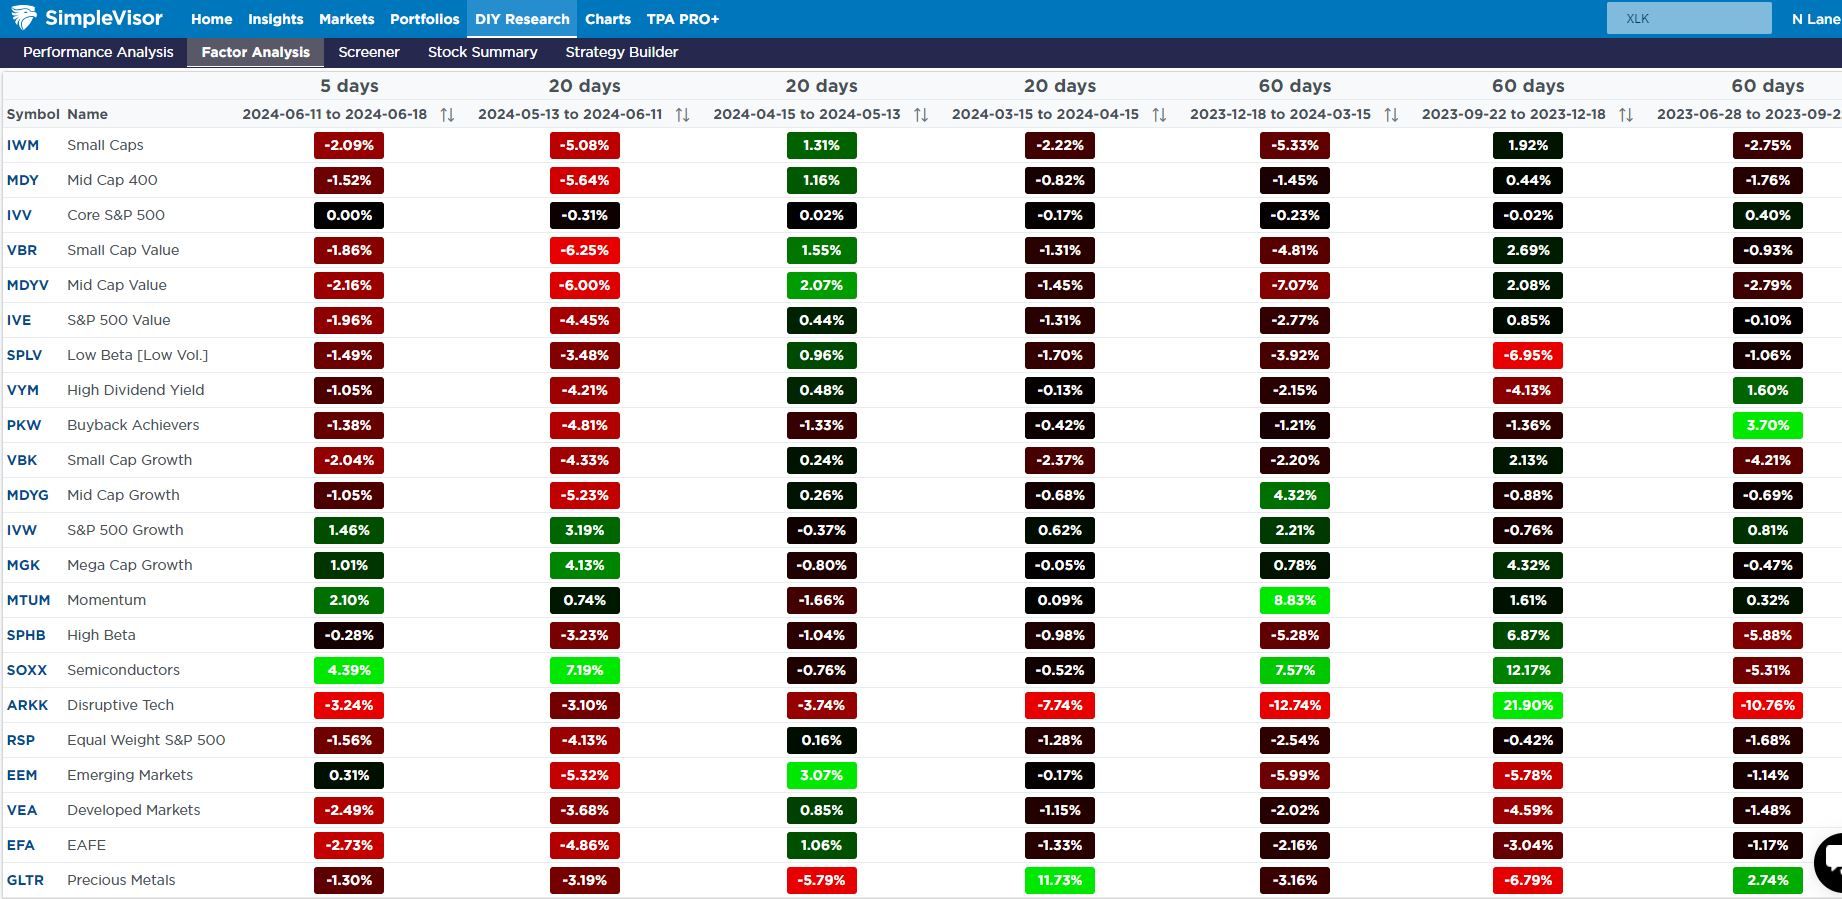
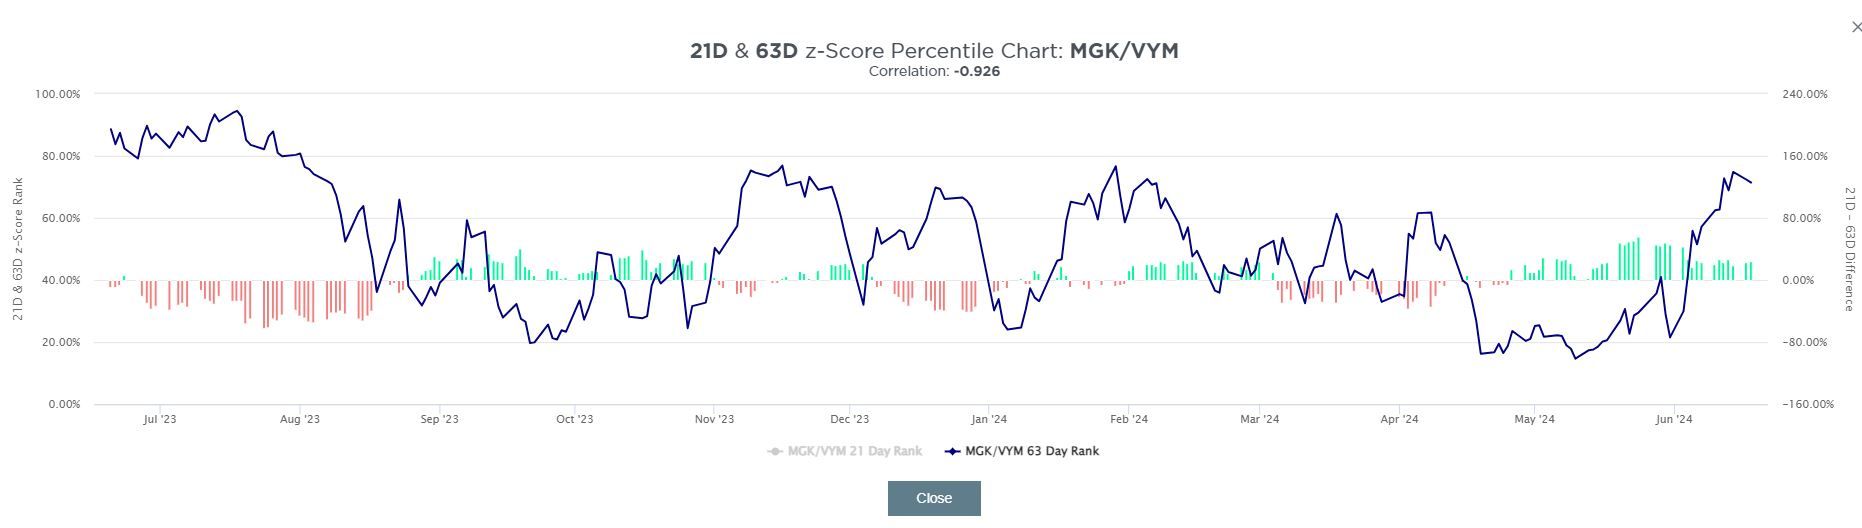
The two graphs below show the SimpleVisor proprietary factor analysis tool. It helps users identify factor trends as they occur and notice when relationships are becoming stretched. The tool focuses on the relative performance of various factors to the S&P 500 and plays on the concept of reversion to the mean with negatively correlated factor pairs. One of the most reliable pairs compares the excess return of MGK (Mega Cap Growth) to that of VYM (High Dividend Yield). The pair has a 252-day correlation in excess returns of -0.94.
The first table depicts the factors’ performance relative to the index over discrete periods, forming a type of heat map. As shown below, Mega Cap Growth and Large Cap Growth are two of the few factors that have outperformed that index since mid-May. Small and mid-cap growth have largely underperformed as breadth narrows to a few stocks.
The second chart below illustrates the level to which the relationship of outperformance between MGK and VYM is currently stretched. The pair is trading in the 72nd percentile of the 3-month average daily excess return relationship- a level that has commonly seen a reversal over the past year. The short-term relationship is even more protracted, trading in the 95th percentile. Given the simultaneous overbought level in the market, this relationship could face slight normalization in the short term.
Tweet of the Day
“Want to achieve better long-term success in managing your portfolio? Here are our 15-trading rules for managing market risks.”