
Inflation And Loose Financial Conditions
Our central thesis of last’s night piece is that inflation is rapidly accelerating, not just due to the “base effect,” and that financial conditions are far too loose.
We’ve taken the previous three very hot core inflation prints – 0.7%, 0.9%. 0.3% — to construct an annualized 3-month core inflation rate. It’s now running at 8.21 percent, its highest level since July 1982, when financial conditions were very tight during Volcker’s war on inflation, and a month that ranked in the 97 percentile in terms of the most restrictive financial conditions measured by the Chicago’s Fed’s National Financial Condition Index (NFCI).
May’s NFCI was still extremely loose. in the 14th percentile of tight monetary conditions out of the 604 months of the life of the index.
Our Point
That is our point: rapidly accelerating and high short-term inflation with extremely loose financial conditions.
The following chart illustrates our 3-month core CPI index with an adjusted version – 3-month core CPI minus a scaled-up version of the NFCI. It gives more context to the historical inflation data as to whether financial conditions are tight or easy.
Our adjusted core CPI index came in at 8.92 percent in May, the highest since September 1981.

Feels Like 1977
We also looked at all the monthly inflation prints for our core CPI data in the bottom quintile of the months with the easiest financial conditions — i.e., the 20 percent of the 600 plus months where the NFCI was less than -.66215. Just an aside, the monetary authorities, though they have a considerable influence on the NFCI, market conditions, such as the stock market, credit spreads, mortgage rates, also play a huge role. Here are the 105 indicators the NFCI is constructed from.
Case in point, during the depths of the Great Financial Crisis (GFC), even while the Fed was in panic-easing mode, November and December 2008 ranked in the 96th percentile of tightest financial conditions in the history of the NFCI. That was a rare case but becoming more common as financial markets now have an outsized influence on the asset-dependent economy.

The above table illustrates that in the bottom quintile of the months with the easiest financial conditions as measured by the NFCI, the May 3-month core CPI print was the highest of the bottom quintile, somewhat disturbing as it joins the unique company of months just before the big inflation spike during the Carter administration.
Monetizing The OPEC Supply Shock
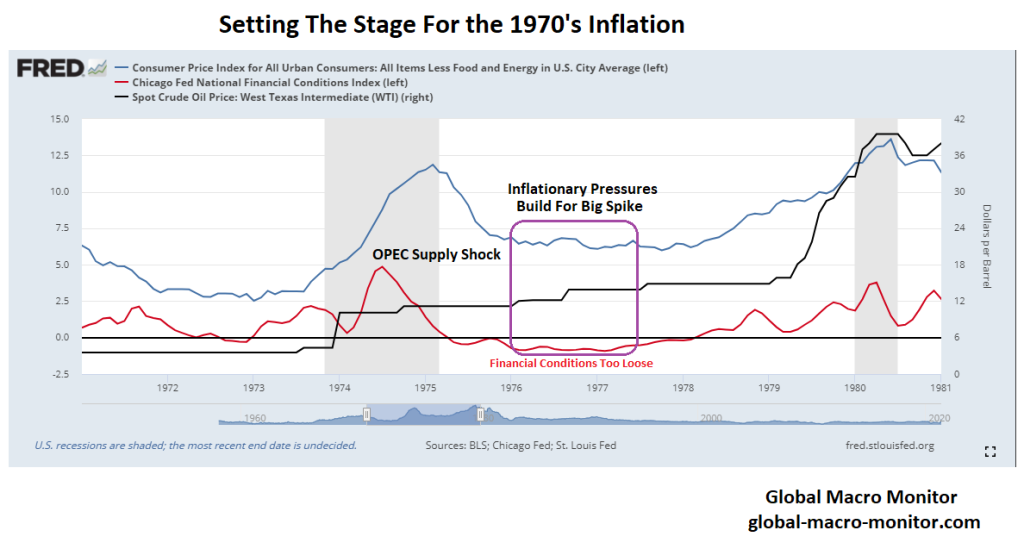
History Repeating?
Monetary policymakers are faced with a similar dilemma as they were during the mid-1970’s – though there are also many differences. Faced with the COVID pandemic supply shock, they also seem, at least to us, to be repeating the same mistaken reasoning and logic as economic policymakers did back then.
In the middle of 1973, wholesale prices of industrial commodities were already rising at an annual rate of more than 10 per cent; our industrial plant was operating at virtually full capacity; and many major industrial materials were in extremely short supply” (Burns 1974).
…The intellectual consensus among policymakers at the time was that cost-push inflation (the type of inflation arising from an increase in the prices of inputs to the economy, i.e., worker wages) was outside the influence of monetary policy (Romer and Romer 2012). In the words of an economist who presented to the Federal Open Market Committee in May of 1971, “the question is whether monetary policy could or should do anything to combat a persisting residual rate of inflation … The answer, I think, is negative. … It seems to me that we should regard continuing cost increases as a structural problem not amenable to macro-economic measures” (Romer and Romer 2012). – Federal Reserve History
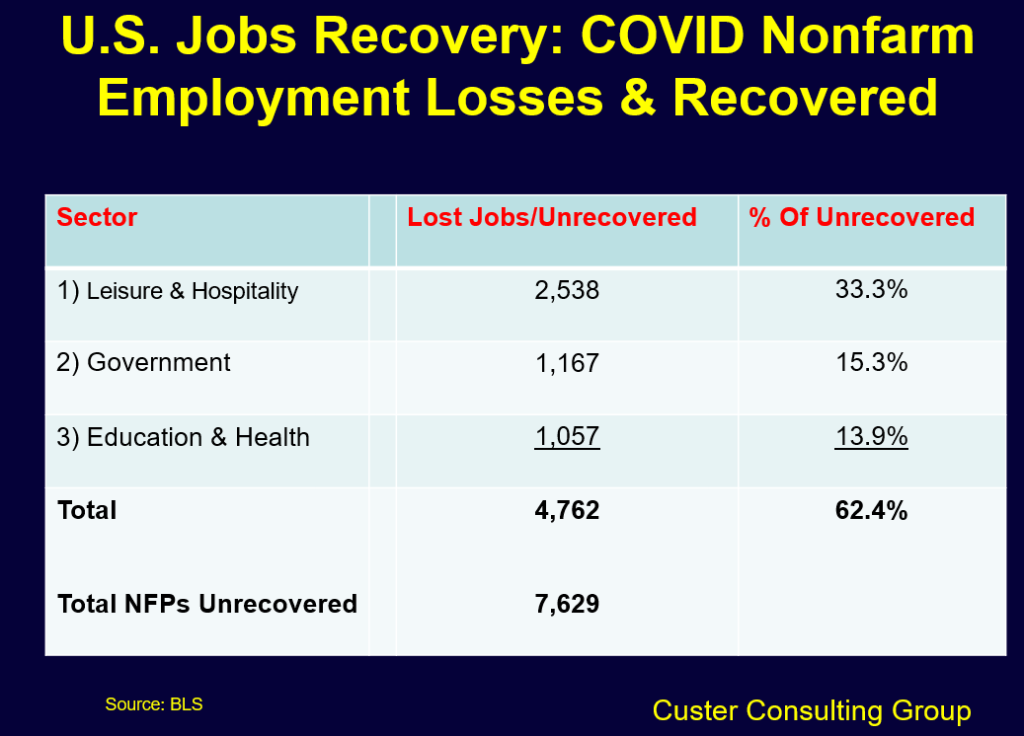
Lack Of Demand Isn’t The Problem, Too Much Demand Is The Problem
We can’t understand why the Fed continues to focus on recovering all the jobs lost during the pandemic by continuing to stimulate demand. For sure, we want everyone that wants to work to have a job and at a decent wage. But…
We snapped this picture last week at a local fast food joint,

Of the 7.6 million unrecovered jobs lost to COVID, 33.3 percent are in leisure and hospitality, and that so-called “huge surplus labor pool” seems more a mirage than reality, as the Fed appears to believe.
How in God’s name is the continued monthly purchase of $40 billion in mortgage-backed securities by the Fed going to help the above restaurant hire, retain, and get its workers to show up? We even now have trouble securing Uber rides as there is a shortage of drivers on the road in our county.
The unemployment benefits have clearly distorted the labor markets. That is a positive statement absent of any political judgment. We are all for more jobs and workers making higher real wages, but it must be practical, effective, and noninflationary. We would take a different approach.
The role of policy, in our book, should be: 1) create an environment where business thrives within the rules, 2) workers are protected and given a boost, if needed, to help them become more productive 3) provide an effective and efficient safety net for those most in need. The private sector creates the wealth, often partnering with the government — markets first, then government when markets fail. Markets do fail.
Retail Sales Whipsawed & The Bullwhip Effect
Take a look at how retail sales have been whipsawed during the panic, which has wreaked havoc in global supply chains — yes, excess demand is the main problem — through the “bullwhip effect.”
Let’s consider a retailer sells on average 10 ice creams per day in the summer season. Following a heatwave the retailer’s sales increase to 30 units per day, in order to meet this new demand, the retailer increases their demand forecast and places an increased order on the wholesaler to 40 units per day in order to meet the new customer demand levels and to buffer any potential further increase in demand, this creates the first wave in the exaggerated demand being driven down the supply chain.
The wholesaler noticing this increase in demand from the retailer may then also build an incremental increase into their forecast so generating a larger order on the ice cream manufacturer, rather than ordering 40 units to be manufactured, the wholesaler may order 60 units from the manufacturer, this will further exaggerate the demand down the supply chain and so creates a second wave of demand increase.
The manufacturer also feeling the increase in demand from the wholesalers may also react to the increase by increasing their manufacturing run to 80 units, this creates a third wave in the exaggeration of demand.
The retailer may run out of stock during the heatwave whilst the manufacturer is producing new stock and may take the option of switching to an alternative brand to meet customer demand, this will then create a false demand situation as sales appear to slump to next to nothing so the retailer may then not place further demand for the original ice cream brand even though the manufacturer has increased their production runs. Alternatively, if the weather changes and the end consumers slow down on purchasing ice creams, this could result in an overstock situation across the supply chain as each tier of the supply chain has reacted to the heatwave sales and increased their demand. This is an example of the waves and troughs in the bullwhip effect. – CIPs
The problems in the supply chains are now starting to reduce production and constrain economic growth. Of course, it’s more complicated than our little story but using monetary policy to fine-tune the economy is like trying to thread a needle with boxing gloves on.
Nevertheless, excess demand is a much better problem than no demand, but the stimulus should have been more targeted to those in most need, which is more of a fiscal issue.
Hindsight and criticism from those not in the arena?
Guilty as charged but let us learn from our mistakes.

Upshot
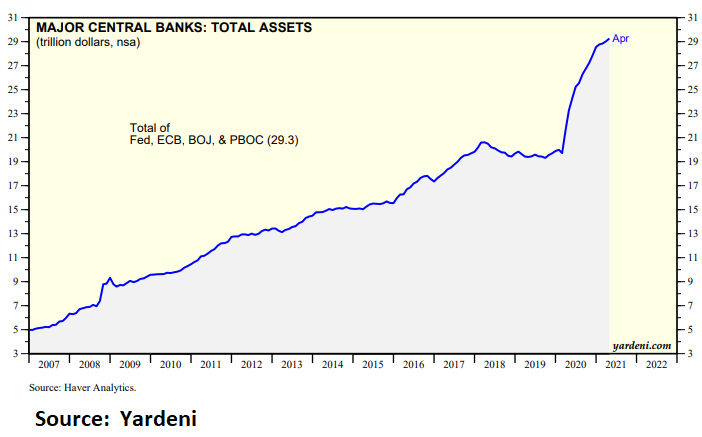
Even if the problems in the supply chain are resolved relatively quickly, we still believe inflation is headed higher for longer, provided the financial markets don’t collapse. The following chart makes us confident – though not certain — of our view.
Global central banks have increased their balance sheets by $10 trillion, 50 percent in the past year, and banks now seem eager to lend into the coming Summer of Love The global money punch blow overfloweth big time
Corner Solution: Inflation Or Deflation
Finally, we believe there is very little middle ground in the inflation/deflation debate — i.e., only a corner solution, either high inflation or deflation.
Asset markets are now divorced from economic reality and extremely overvalued. They have such an outsized influence on the economy that any significant correction or disruption will severely tighten financial conditions.
The central banks’ digital printing presses will then be fired up even further, and the endgame, in our opinion, will probably be high inflation for an extended period.
There is no longer any political will to allow true price discovery in the markets. Every 20 point drop in the S&P, the Wall Street clowns cry for a bailout.


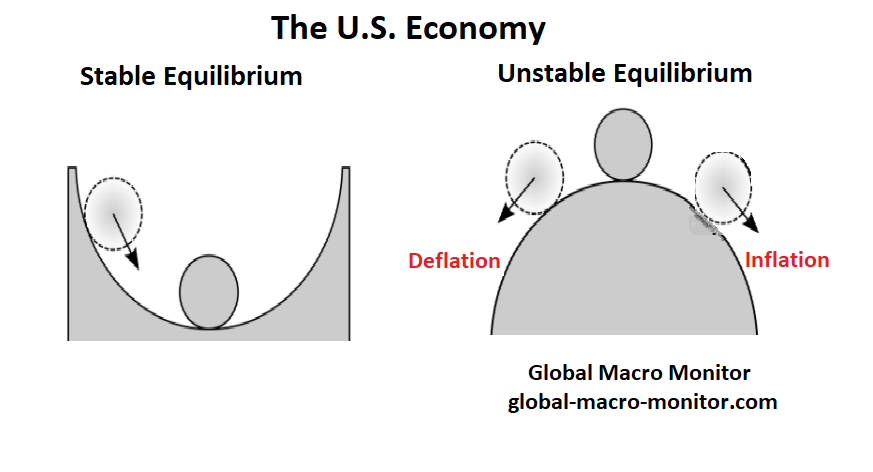
Upshot
We believe the U.S. economy is in an unstable equilibrium — if there is such a thing — and fancy the following chart as it encapsulates our macro view in one simple illustration.
We now eagerly wait to be lectured by the 14-year doggie coin traders to tell us how wrong we are.
We’re hedged, however, as we always reserve the right to be wrong, and often are.
Calling the markets? Not in your wildest dreams. It’s hard to predict what kind of pizza Elon may eat on any given day and how it may affect what he Tweets.
Never in my wildest imagination did I think the financial markets would become the farce they have.
Stay tuned, folks. and please continue to pray/think positively for CK’s recovery.
Related: