
Trending


Presidential elections and market corrections have a long history of companionship. Given the rampant rhetoric between the right and left, such is not surprising. Such is particularly the case over the last two Presidential elections, where polarizing candidates trumped policies.
From a portfolio management perspective, we must understand what happens during election years concerning the stock market and investor returns.
Since 1833, the S&P 500 index has gained an average of 10.03% in the year of a presidential election. By contrast, the first and second years following a Presidential election see average gains of 6.15% and 6.94%, respectively. There are notable exceptions to positive election-year returns, such as in 2008, when the S&P 500 sank nearly 37%. (Returns are based on price only and exclude dividends.) However, overall, the win rate of Presidential election years is a very high 76.6%
Since President Roosevelt’s victory in 1944, there have only been two losses during presidential election years: 2000 and 2008. Those two years corresponded with the “Dot.com Crash” and the “Financial Crisis.” On average, the second-best performance years for the S&P 500 are in Presidential election years.
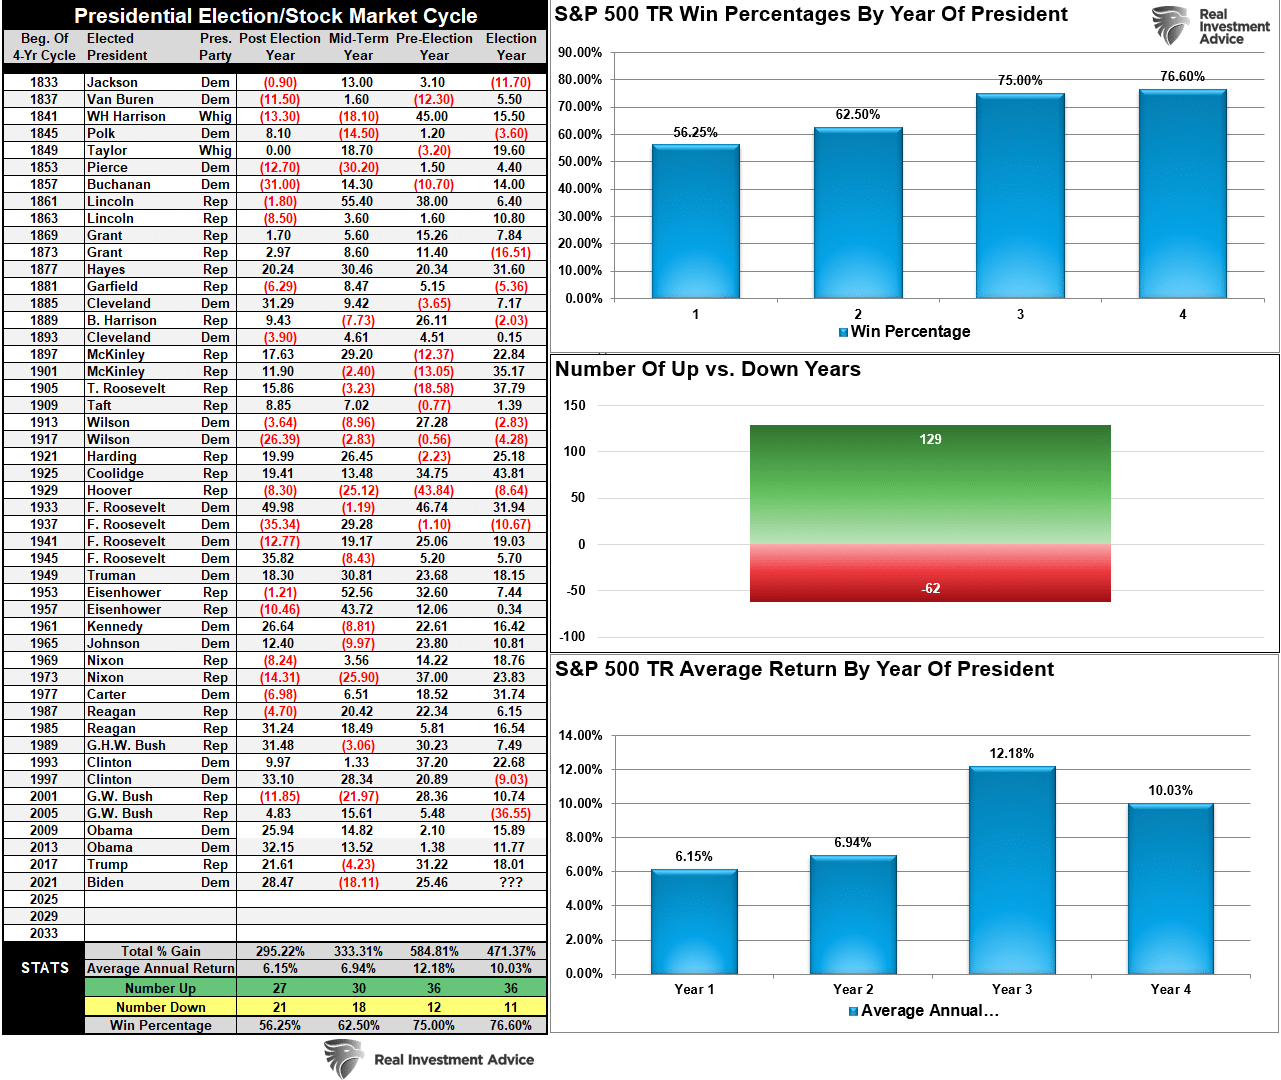
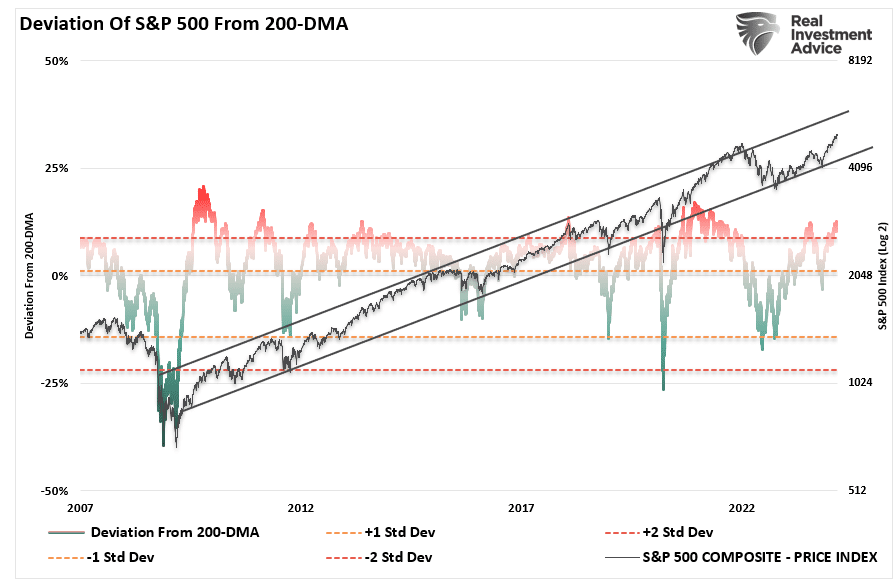
For investors, with a “win ratio” of 76%, the odds are high that markets will most likely finish the 2024 Presidential election year higher. However, given the current economic underpinnings, I would caution completely dismissing the not-so-insignificant 24% chance that a more meaningful correction could reassert itself. Given the recent 15-year duration of the ongoing bull market, the more extreme deviations from long-term means, and ongoing valuation issues, a “Vegas handicapper” might increase those odds a bit.
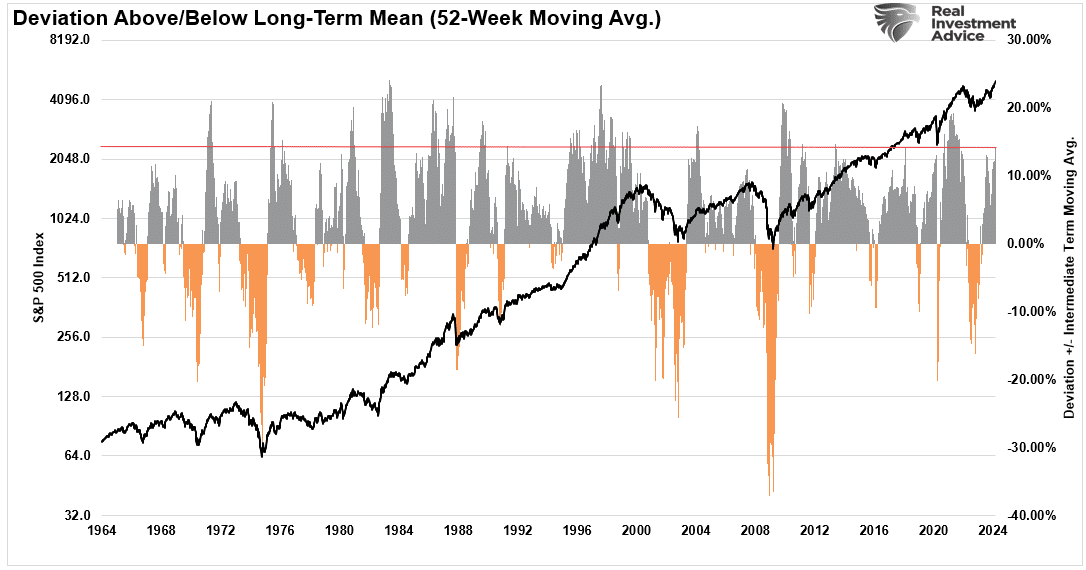
That deviation is more significant when looking at the 1-year moving average. Current deviation levels from the 52-week moving average have generally preceded short-term market corrections or worse.
However, as stated, while the market will likely end the year higher than where it started, Presidential election years have a correctional bias to them during the summer months.
Will Policies Matter
The short answer is “Yes.” However, not in the short term.
Presidential platforms are primarily “advertising” to get your vote. As such, a politician will promise many things that, in hindsight, rarely get accomplished. Therefore, while there is much debate about whose policies will be better, it doesn’t matter much as both parties have an appetite for “providing bread and games to the masses” through continuing increases in debt.
However, regarding the financial markets, Wall Street tends to abhor change. With the incumbent President, Wall Street understands the “horse the riding.” The risk to elections is a policy change that may undermine current trends. Those policy changes could be an increase in taxes, restrictive trade policies, cuts to spending, etc., which would potentially be unfriendly to financial markets in the short term.
This is why markets tend to correct things before the November elections. A look at all election years since 1960 shows that markets did rise during election years. However, notice that the market tends to correct during September and October.
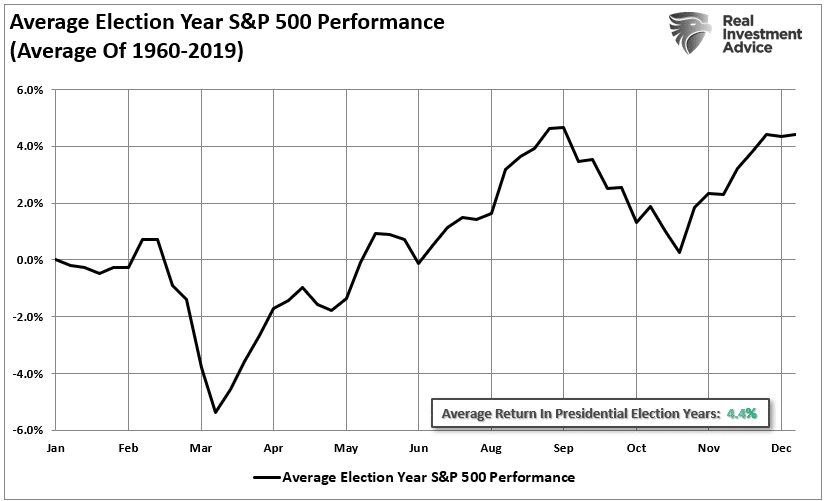
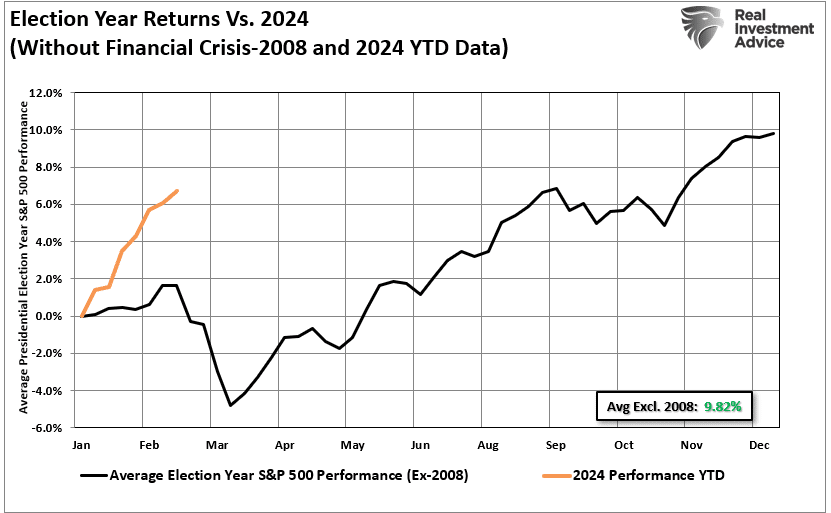
Notably, that data is heavily skewed by the decline during the 2008 “Financial Crisis,” also a Presidential election year. If we extract that one year, returns jump to 7.7% annually in election years. However, in both cases, returns still slump during September and October. The chart below shows that 2024 is running well ahead of historical norms.
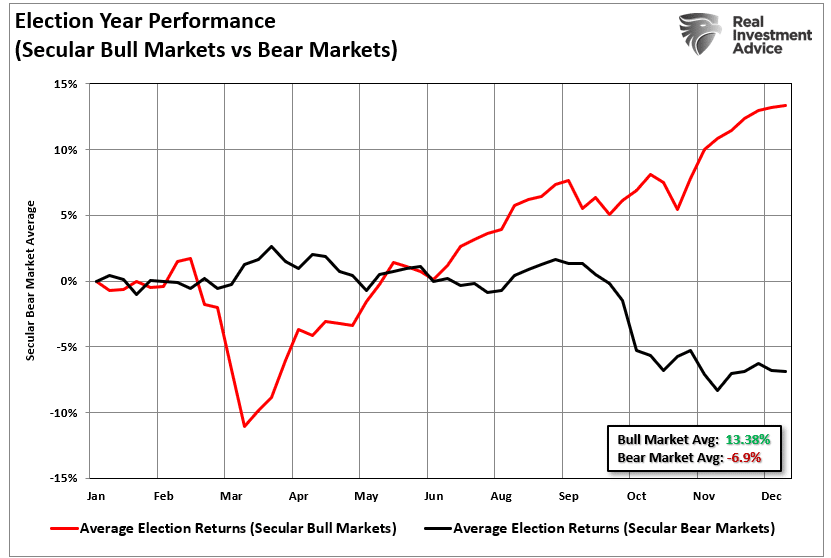
Lastly, while policies matter over a longer-term period, as changes to spending and regulation impact economic outcomes, market performance during SECULAR market periods varies greatly. During secular (long-term) bull markets, as we have now since 2009, Presidential election years tend to average almost 14% annually. That is opposed to secular bear markets, which tend to decline by 7% on average.
However, one risk that has taken shape since the “Financial Crisis” could have an outside effect on the markets in 2024.
The Great Divide
While you may feel strongly about one party or the other regarding politics, it doesn’t matter much regarding your money.
Such is particularly the case today. As we head into November, for the third election in a row, voters will cast ballots for the candidate they dislike less, not whose policies they like more. More importantly, most voters are going to the polls with large amounts of misinformation from social media commentators pushing political agendas.
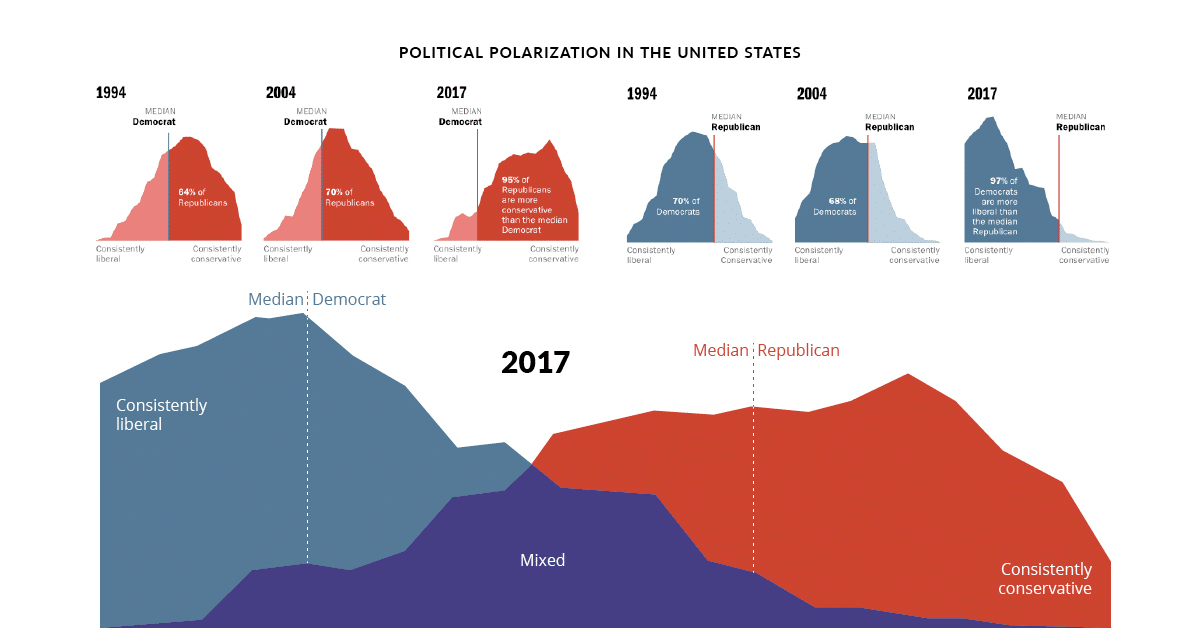
Notably, the market already understands that with the parties more deeply divided than at any other point in history, the likelihood of any policies getting passed is slim. (2017 was the latest data from a 2019 report. Currently, that gap is even more significant as Social Media continues to fuel the divide.)
The one thing markets do seem to prefer – “political gridlock.”
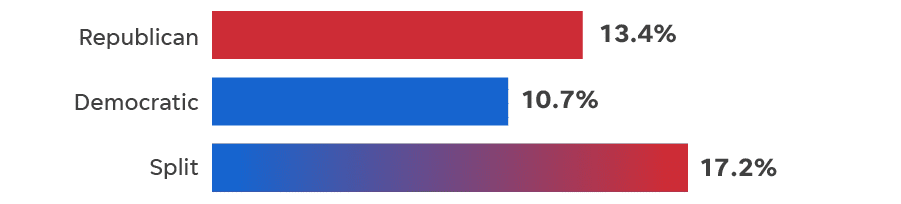
“A split Congress historically has been better for stocks, which tend to like that one party doesn’t have too much sway. Stocks gained close to 30% in 1985, 2013 and 2019, all under a split Congress, according to LPL Financial. The average S&P 500 gain with a divided Congress was 17.2% while GDP growth averaged 2.8%.” – USA Today
What we can derive from the data is the odds suggest the market will end this year on a positive note. However, such says little about next year. If you go back to our data table above, the 1st year of a new Presidential cycle is roughly a 50/50 outcome. It is also the lowest average return year, going back to 1833.
Furthermore, from the election to 2025, outcomes have been overly dependent on many things continuing to go “right.”
- Avoidance of a “double-dip” recession. (Without more Fiscal stimulus, this is a plausible risk.)
- The Fed drastically expands monetary policy. (Such won’t come without a recession.)
- The consumer will need to expand their current debt-driven consumption. (This is a risk without more fiscal stimulus or sustainable economic growth.)
- There is a marked improvement in both corporate earnings and profitability. (This will likely be the case as mass layoffs benefit bottom-line profitability. However, top-line sales remain at risk due to items #1 and #3.)
- Multiple expansions continue. (The problem is that a lack of earnings growth in the bottom 490 stocks eventually disappoints)
These risks are all undoubtedly possible.
However, when combined with the longest-running bull market in history, high valuations, and excessive speculation, the risks of something going wrong have risen.
So, how do you position your portfolio for the election?
Portfolio Positioning For An Unknown Election Outcome
Over the last few weeks, we have repeatedly discussed reducing risk, hedging, and rebalancing portfolios. Part of this was undoubtedly due to the exaggerated rise from the November lows and the potential for an unexpected election outcome. As we noted in “Tending The Garden:”
“Taking these actions has TWO specific benefits depending on what happens in the market next.
- If the market corrects, these actions clear out the ‘weeds’ and allow for protection of capital against a subsequent decline.
- If the market continues to rally, then the portfolio has been cleaned up, and new positions can be added to participate in the next leg of the advance.
No one knows for sure where markets are headed in the next week, much less the next month, quarter, year, or five years. What we do know is not managing ‘risk’ to hedge against a decline is more detrimental to the achievement of long-term investment goals.”
That advice continues to play well in setting up your portfolio for the election. As outlined, the historical odds suggest that markets will rise regardless of the electoral outcome. However, those are averages. In 2000 and 2008, investors didn’t get the “average.”
Such is why it is always important to prepare for the unexpected. While you certainly wouldn’t speed down a freeway “blindfolded,” it makes little sense not to be prepared for an unexpected outcome.
Holding a little extra cash, increasing positioning in Treasury bonds, and adding some “value” to your portfolio will help reduce the risk of a sharp decline in the months ahead. Once the market signals an “all clear,” you can take “your foot off the brake” and speed to your destination.
Of course, it never hurts to always “wear your seatbelt.”
Related: Investor Caution: Analyzing Valuation Metrics and Volatility Signals