
Trending


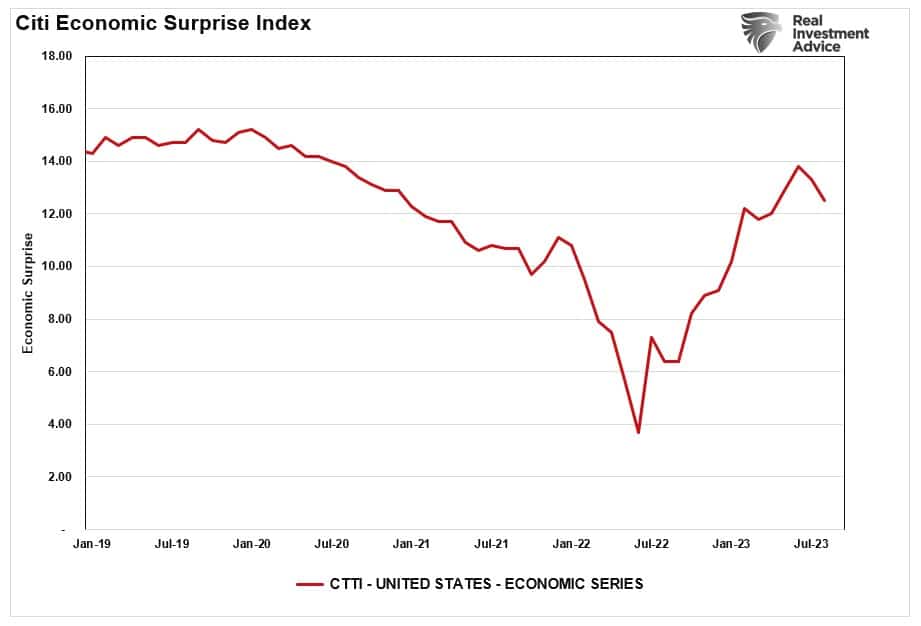
Since the beginning of the year, economic data has continued to defy the recession calls of 2022. Therefore, it is unsurprising that economic data surprised analysts’ more dire predictions last year. Of course, given the underestimation of the economy previously, the risk of overestimation is now a real possibility.
The upgrading of estimates also contributed to the discussion of the Federal Reserve’s need to raise the “neutral rate.”
The neutral interest rate is:
“The real rate (net of inflation) that supports the economy at full employment and maximum output while keeping inflation constant.“
(Note: There is no accurate measure of the neutral rate, and it cannot be observed directly. In other words, it is a guess.)
The issue, as always, is that economists are looking at lagging economic data to make assumptions about the future. However, after over 40 years of rising debt levels, economic growth remains slowing. As shown, as debt issuance increased after each economic crisis since the turn of the century, economic growth rates declined. (I have projected the increase in debt based on the average quarterly debt growth since 2018.)
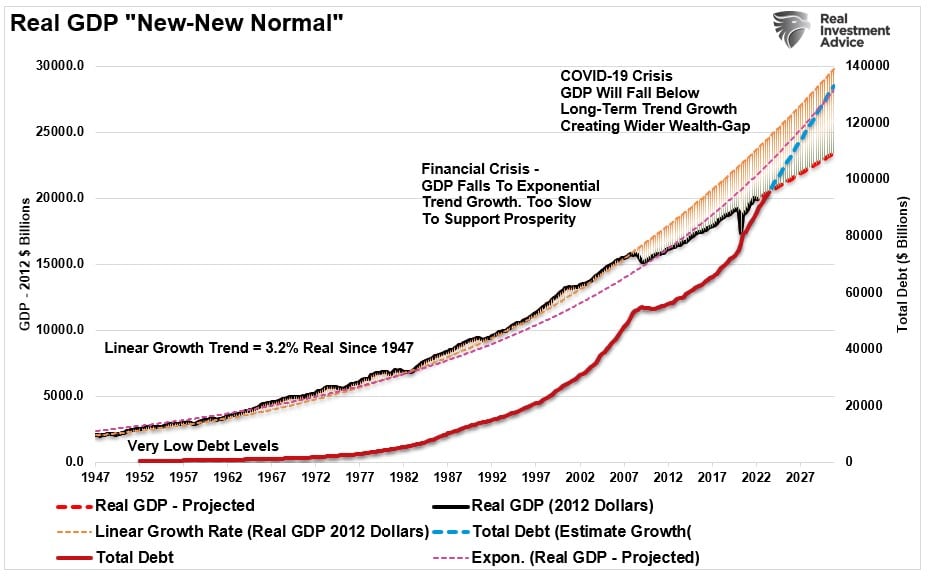
Naturally, if the economy grows at a slower natural rate, inflation and interest rates will ultimately match that growth rate. Furthermore, and most importantly, in the context of this discussion, avoiding a recession becomes increasingly challenging at lower growth rates.
While analysts become more optimistic about economic growth, the divergence of the economic data suggests increased risk to that outlook.
Production Comes First
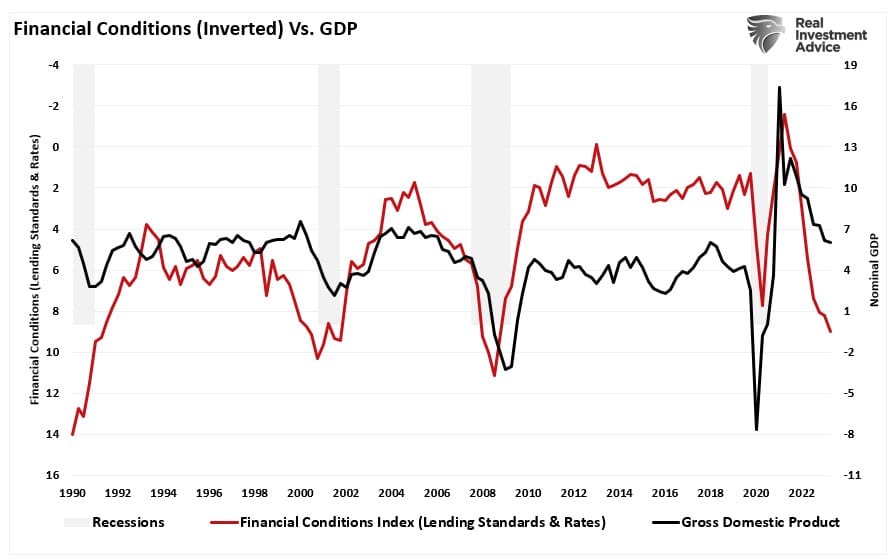
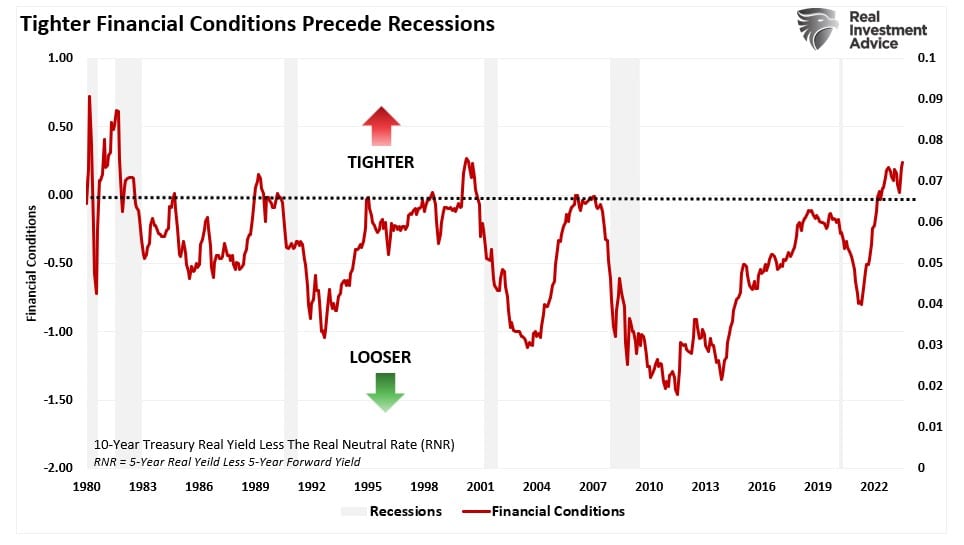
As is always the case, predicting a recession is incredibly difficult. The influence of monetary and fiscal policy, corporate actions, and other events can increase or delay the recessionary onset. Nonetheless, restrictive policies, such as higher interest rates and tighter lending standards, will curtail the consumption that drives economic growth. The chart below is a composite index of bank lending standards and interest rates versus GDP. The financial conditions composite is inverted to compare declines in economic activity better. Unsurprisingly, tight financial conditions always precede weaker economic growth rates and recessions.
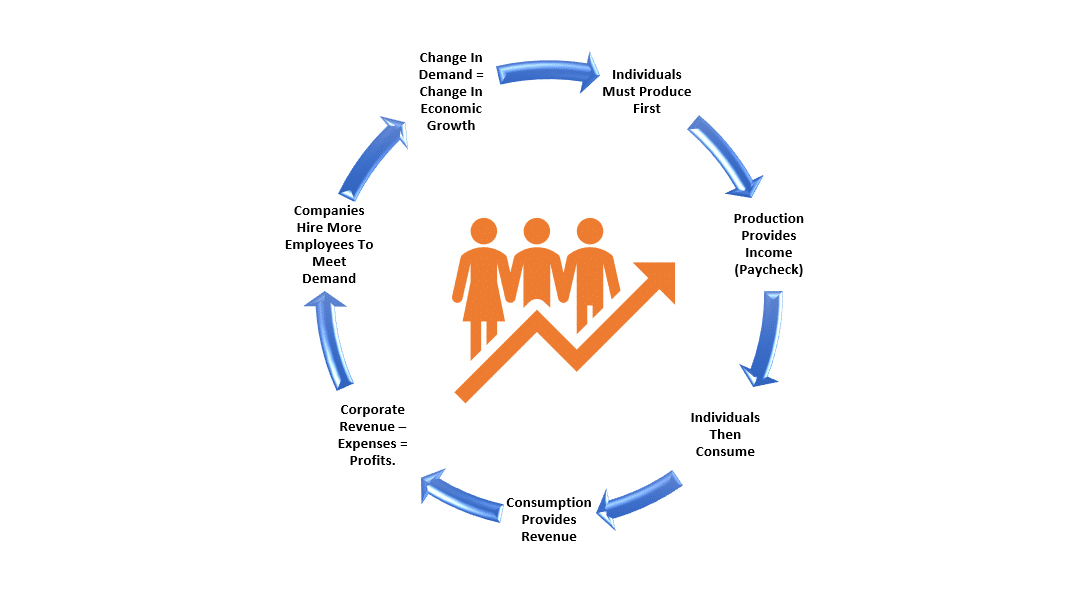
Critically, what drives the economic cycle must be understood. We often speak of the consumption side of the economic equation; however, consumers can not consume without producing something first. Production must come first to generate the income needed for that consumption. As analysts increase earnings estimates, the earnings derived from corporate revenues are a function of consumer spending. Such is a crucial part of the cycle.
The Invisible Hand
Of course, if you bypass the production phase of the cycle by sending checks directly to households, you will get a strong surge in economic growth. As shown in the chart below, the massive spike in economic growth in the second quarter of 2021 directly resulted from those fiscal policies.
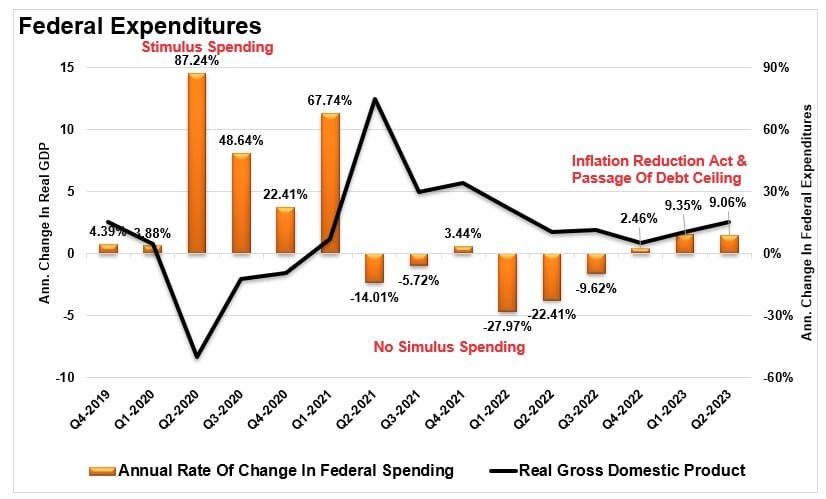
However, once individuals spent that stimulus, the economic activity subsided as the production side of the equation was still lagging. Here is the crucial point. For a household to consume at an economically sustainable rate, such requires full-time employment. While the media touts the “strong employment reports,” such is mostly the recovery of jobs lost during the economic shutdown. As shown, full-time employment as a percentage of the working-age population has only recovered to pre-pandemic levels.
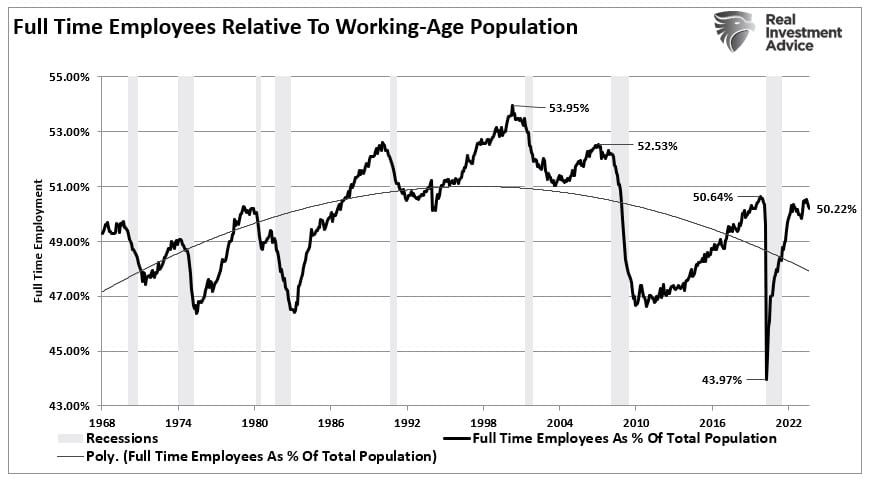
In other words, we have NOT created millions of new jobs, as touted by the current administration, but rather only recovered the jobs lost and the increase in the working-age population since the economic shutdown. However, higher inflation and interest rates require more income to maintain the same growth rates.
The production side of the equation is now ringing a loud alarm.
The GDP & GDI Relationship
Let’s review the economic cycle equation once again.
Production => Incomes => Consumption => Demand => Increased Employment => Increased Wages
It is a relatively simple economic concept that seems to elude the vast majority of mainstream analysts and, seemingly, the Federal Reserve itself. However, there are two measures of economic activity. The most common measure is GDP, which is simply the sum of Personal Consumption Expenditures (PCE), Business Investment, Government Spending, and Net Exports (Exports Less Imports)
The other less observed measure is Gross Domestic Income (GDI). The calculation of GDI is as follows:
GDI = Wages + Profits + Interest Income + Rental Income + Taxes – Production/Import Subsidies + Statistical Adjustments.
Therefore, given that GDI measures the income side of the equation (derived from production), it is logical that GDI should track pretty closely to GDP over time. Furthermore, it should be logical that deviations between production and consumption should indicate a shift in the economic underpinnings.
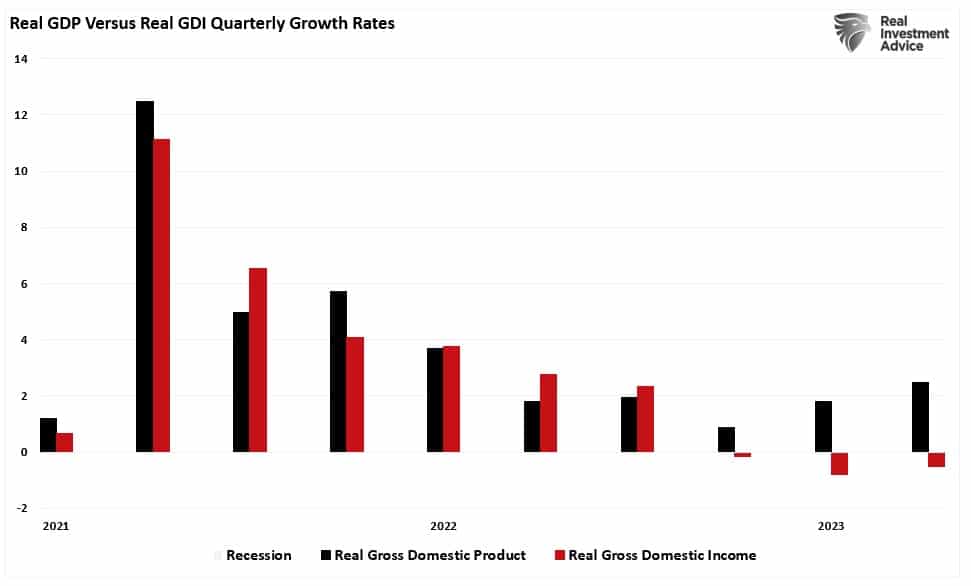
As shown below, in 2021 and 2022, real (inflation-adjusted) GDI supported economic growth. With $5 Trillion in stimulus supporting incomes, the consumption side of the equation rose. However, beginning in the 4th quarter of 2022 and persisting through the 2nd quarter of 2023, GDI has turned negative as all of the stimulative monetary measures have become exhausted. Yet, economic growth has increased sharply over that time frame.
The following chart is a bit clearer. I rebased both GDP and GDI to 100 in 2016. Again, logically, GDI and GDP should track closely to each other given the economic relationship. However, the deviation is apparent starting last year.
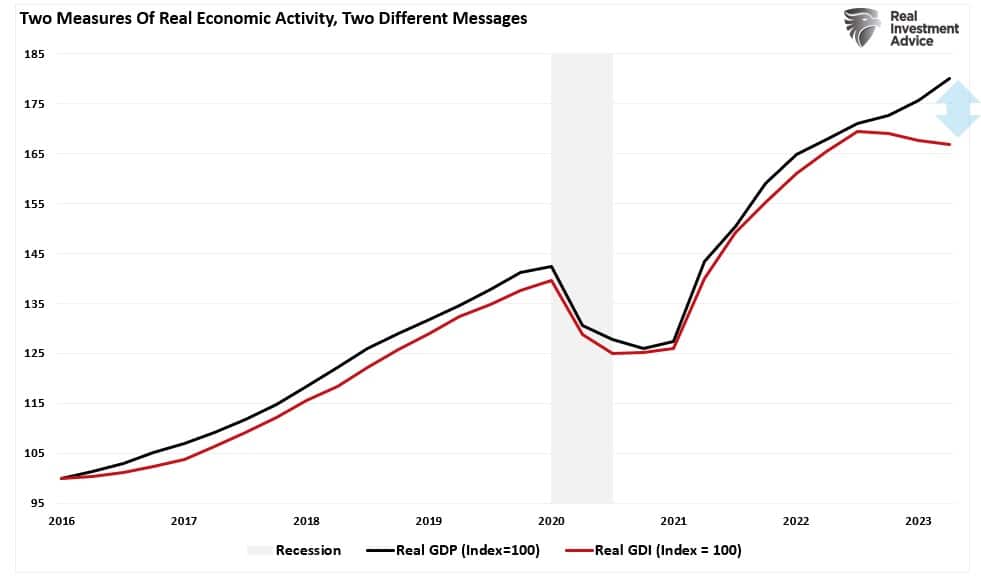
The question is whether this Is an anomaly or has it occurred previously.
GDI Sends A Recession Warning
The short answer is YES.
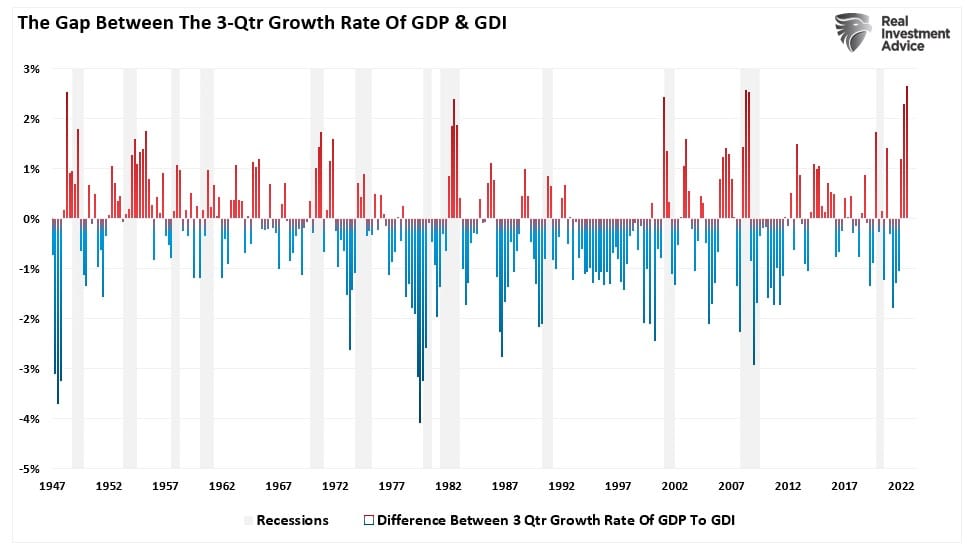
The chart below looks at real GDP and GDI back to 1947 and measures the deviation between the 3-quarter growth rates of each. With only the expectation being in the late 70’s, a recession followed each time GDP deviated from GDI. In other words, the economic activity eventually catches down to the primary driver of consumption: production. Currently, the deviation of GDP from GDI is the largest on record.
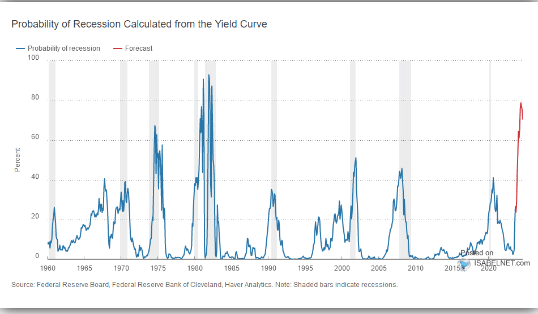
In past articles, we reviewed many indicators that typically preceded recessionary onsets. Falling tax receipts, inverted yield curves, student loan payments, leading economic indicators, and even our economic composite confirm that recessionary risks remain elevated. As shown, based solely on the inverted yield curve alone, the probability of a recession is at one of the highest levels since the 1980s.
Given the wide range of other confirming indicators previously discussed, betting on the “avoidance” of a recession, particularly given such tight financial conditions, seems risky. Such was a point made in “Financial Conditions Are Tighter Than You Think.” To wit:
“As shown below, financial conditions, measured by the difference between the 10-year Treasury yield and the “neutral rate,” clearly reside in restrictive territory. Such has previously always preceded an economic downturn since 1980.”
However, even if you want to dismiss all of the other indicators discussed previously under the guise of “it’s different this time,” the recessionary warning sign sent by the spread between GDP and GDI should likely not be.
Sure, this “time could be different.” The problem is that, historically, such has not been the case. While we must weigh the possibility that analysts are correct in their more optimistic predictions, the probabilities still lie with the indicators.
GDI is increasing those probabilities.