
Trending

Written by: Rafael Zorabedian
Today’s CPI release is in focus as inflation doubles expectations. Tech is leading in morning trade today in New York.
Bank earnings were strong this morning; with JP Morgan Chase (JPM) and Goldman Sachs (GS) having big beats versus analyst expectations. These strong earnings results are being overshadowed mid-session with yet another giant print in CPI data.
Giant CPI Data Print
This morning, the market consensus was for a CPI print of 0.5%, but yet again, we got a huge number at 0.9%. This level is the highest since 2008 and has seemed to put a cloud over today’s trade in New York. The S&P 500 is essentially flat so far today, after dipping 20 handles on the 8:30 AM data release and recuperating all of the CPI news release losses by 10:00 AM. It is one of those kinds of trading sessions so far, but we still have several hours to go today. Tech continues to be strong today, with many individual names lighting up green on the screen. Is the tech trade getting somewhat crowded at these levels?
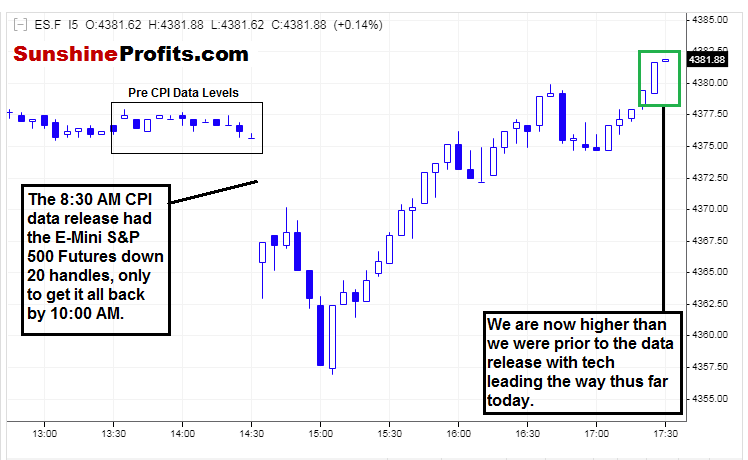
Figure 1 - E-Mini S&P 500 Futures (September Contract) July 12, 2021 - July 136, 2021, 5 Minute Candles Source stooq.com
Cash traders wouldn’t even know the movement took place.
As today progresses, it feels like the market is digesting the monster CPI print and where capital will be allocated going forward. Interest rates initially fell hard off the data release; but have since been climbing back intraday, as the $SPX has been gaining a little bit of some steam.
There is no question that the S&P 500 is in full resilience mode here. Shaking off the large CPI prints without hesitancy and resuming the upside tells us a story. What the end result of that story is going to be is still up for interpretation. As more time passes and more digestion occurs, the picture will become clearer.
At times like this, I like to allow the data to be digested before making new decisions. This reflection period allows time to manage perspective and outlook on existing opinions/positions.
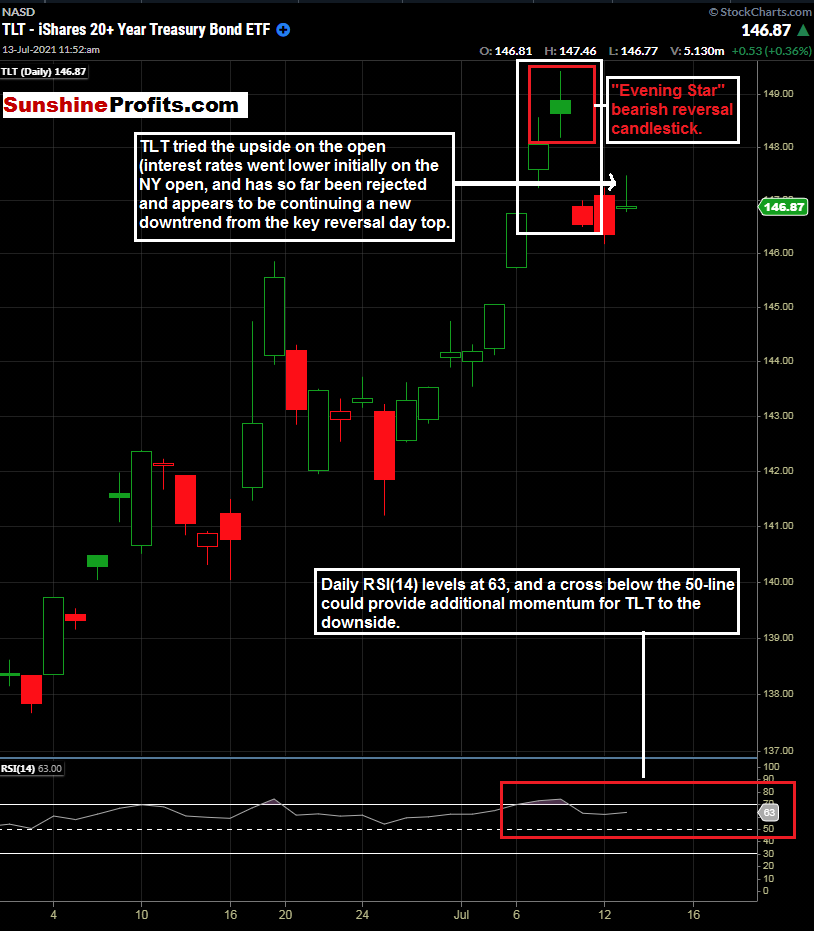
Figure 2 - TLT iShares 20+ Year Bond ETF June 1, 2021 - July 13, 2021, Daily Candles Source stockcharts.com
It is starting to look more and more that we have experienced a key reversal day in TLT and interest rates. The candle formation July 7th - 9th resembles an “Evening Star” formation, and the uppermost candle on July 8th looks like it marks a short-term top.
An evening star formation is a bearish reversal pattern that continues an uptrend with a long green (up)body day followed by a gapped up small body day, then a down close with the close below the midpoint of the first day.
If you are looking to beef up your candlestick knowledge, I highly suggest checking out ChartSchool on Stockcharts. It has been a valuable resource for 20 years and continues to be an excellent reference and knowledge resource.
Right now, let’s see how the remainder of the session plays out given the big bank earnings results so far; and the large CPI data print.
I still like the idea of staying long the banks and short bonds (higher interest rates) at this time.
Related: Labor Market, Productivity Gains Can Fuel Expansion for Some Time
The views and opinions expressed in this article are those of the contributor, and do not represent the views of IRIS Media Works and Advisorpedia. Readers should not consider statements made by the contributor as formal recommendations and should consult their financial advisor before making any investment decisions. To read our full disclosure, please click here.