The stock bears finally showed they aren‘t an extinct species – merely a seriously endangered one. Yesterday‘s close though gives them a chance to try again today, but they should be tame in expectations. While there is some chart deterioration, it‘s not nearly enough to help fuel a full on bearish onslaught in the S&P 500. There is no serious correction starting now, nothing to really take down stocks seriously for the time being.
The Fed remains active, and monetary policy hasn‘t lost its charm (effect) just yet. Commodities and asset price inflation has been in high gear for quite some time, yet it‘s not a raging problem for the Main Street as evidenced by the CPI. Food price inflation, substitution and hedonistic adjustments in its calculation, are a different cup of tea, but CPI isn‘t biting yet.
Meanwhile, the real economy recovery goes on (just check yesterday‘s Empire State Manufacturing figures for proof), even without the $1.9T stimulus and infrastructure plans. Once we see signs of strain in the job market (higher participation rate, hourly earnings and hours worked), then the real, palpable inflation story can unfold. But we‘re talking 2022, or even 2023 to get there – and the Fed will just let it overshoot to compensate for the current and prior era.
Meanwhile, the wave of new money creation (we‘re almost at double the early 2020 Fed‘s balance sheet value - $4T give or take then vs. almost $7.5T now – and that‘s before the multiplier in commercial banks loan creation kicks in) keeps hitting the markets, going into the real economy, predictably lifting many boats. It‘s my view that we have to (and will) experience a stock market bubble accompanied by the precious metals and commodities one – to a degree, simultaneously, for the stock market is likely to get under pressure first. Again, I am talking the big picture here – not the coming weeks.
Meanwhile, the intense talk of S&P 500 correction any-day-week-now is on, just as outrageous gold, silver and miners‘ drop projections.
Let‘s examine the bear market is gold – some say that the late 2015 marked bottom, I‘m of the view that the 2016 steep rally was a first proof of turning tide. But the Fed got serious about tightening (raising rates, shrinking its balance sheet), and gold reached the final bottom in Aug 2018. Seeing through the hawks vs. dove fights at the Fed in the latter half of 2018 (December was a notable moment when Powell refused to the markets‘ bidding, remained hawkish in the face of heavy, indiscriminate selling across the board – before relenting).
Since then, gold was slowly but surely gathering steam, and speculation in stocks was on. The repo crisis of autumn 2019 didn‘t have a dampening effect either – the Fed was solidly back to accomodative back then. These have all happened well before corona hit – and it wasn‘t able to push gold down really much. The recovery from the forced selling, this deflationary episode (which I had notably declared back in summer 2020 to be a one-off, not to be repeated event), was swift. Commodities have clearly joined, and the picture of various asset classes taking the baton as inflation is cascading through the system, is very clear.
Quoting from my yesterday‘s analysis:
(…) The dollar keeps topping out, which I called it to do a week ago – and its losses have been mounting since. Long-dated Treasury yields are rising in tandem, which is a great environment for financials (XLF ETF) and emerging markets (EEM ETF). The former benefit from the widening yield curve, the latter from plain devaluation.
Gold performance is still short-term disappointing, and silver and platinum are leading. But it‘s the miners and the moves between various mining indices, that work to soothe the bulls‘ impatience. Understandable as we are in 5+ months of downside correction whose target I called on Aug 07 in the article S&P 500 Bulls Meet Non-Farm Payrolls, witnessing record pace of new money creation.
The ongoing economic recovery will get new stimulus support, and that will work to broaden the precious metals advance.
Again quoting my Friday‘s words:
(…) in our print-and-spend-happy world, where the give or take $1.9T stimulus will sooner or later come in one way or another, we better prepare on repricing downside risk in the precious metals, and also better not to fixate on the premature bubble pop talk too closely. I have been stating repeatedly that things have to get really ridiculous first, and this just doesn‘t qualify yet in my view. All those serious correction calls have to wait – in tech and elsewhere, for we‘re going higher overall – like it or not.
Let‘s get right into the charts (all courtesy of www.stockcharts.com).
S&P 500 Outlook
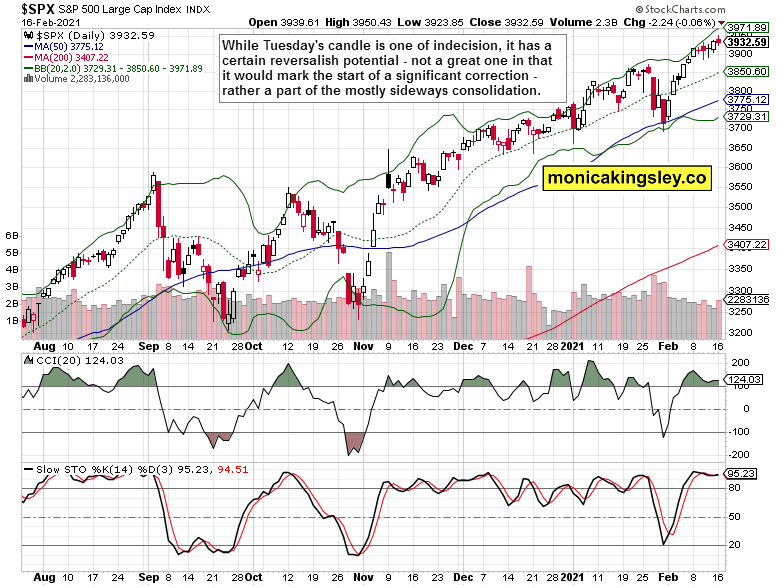
Finally, there is a whiff of bearish activity. Will it last or turn out a one day event as thus far in Feb? The chances for a sideways correction to last at least a little longer, are still on, however the short- and medium-term outlook remains bullish.
Credit Markets and Treasuries
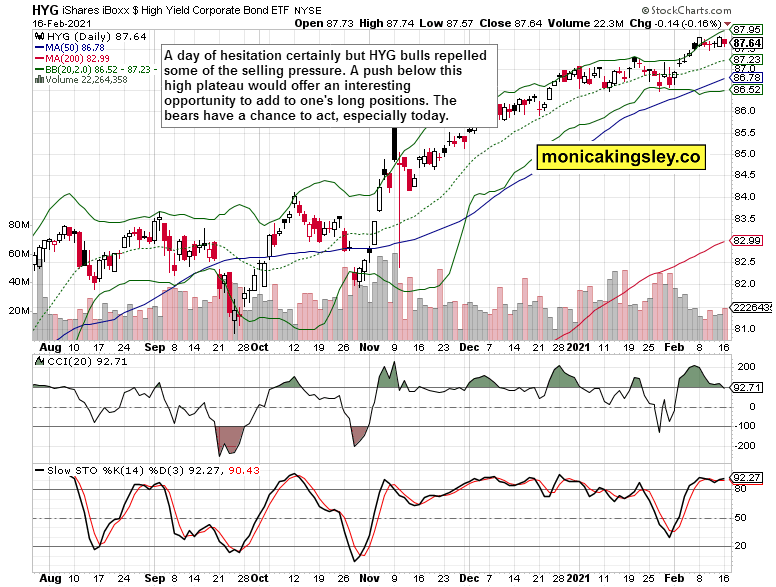
High yield corporate bonds (HYG ETF) wavered yesterday, trading in a sideways pattern during recent days. Encouragingly, yesterday‘s session attracted increasing volume, which I read as willingness to buy the dip. One dip and done?
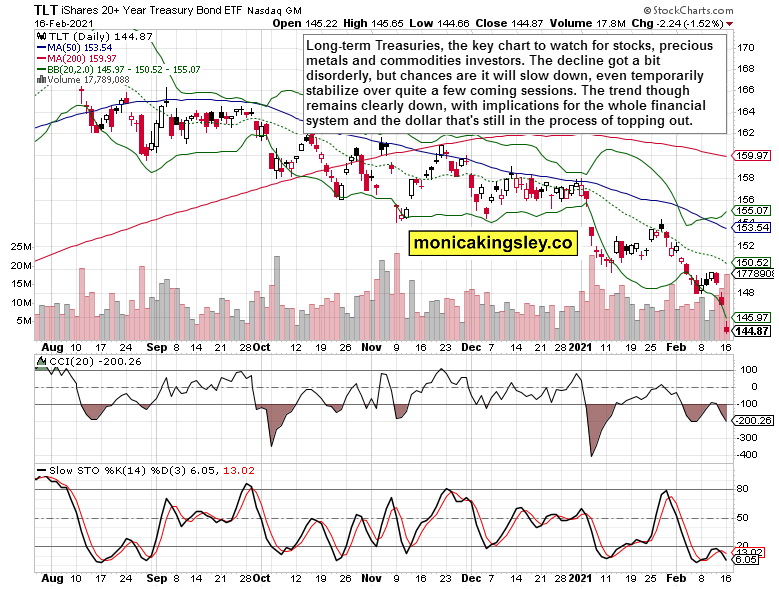
Long-term Treasuries (TLT ETF) are the key chart on my radar screen right now. The rise in yields is accelerating, and if progressing unmitigated, would throw a spanner into many an asset‘s works. Even though it‘s not apparent right now, there is a chance that we‘ll see a slowdown, even a temporary stabilization, over the coming sessions. The larger trend in rates is higher though, and in the dollar to the downside.
Gold, Silver and Commodities
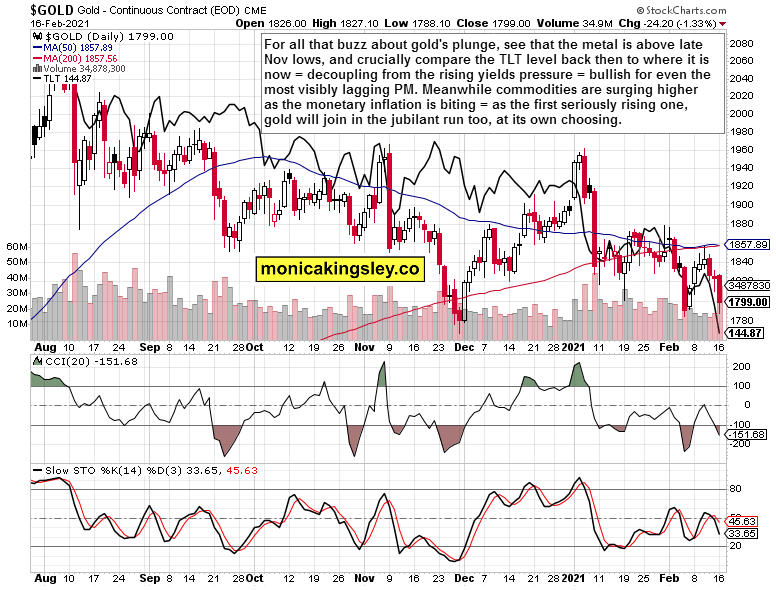
The heat gold is taking from rising Treasury yields, has gotten weaker recently, with the decoupling from rising nominal (real) yields being a good omen for precious metals universally. The dynamics of commodity price inflation, dollar hardly balancing under the weight of unprecedented economic policy and twin deficits, attests to the gold upleg arriving sooner rather than later.
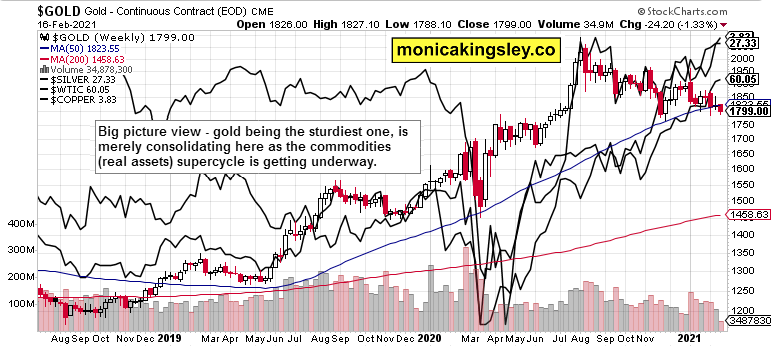
Let‘s step back, and compare the performance of gold, silver, copper and oil. The weekly chart captures the key turns in monetary policy, the plunge into the corona deflationary bottom, and crucially the timing and pace of each asset‘s recovery. Gold and silver were the first to sensitively respond to activist policies, followed by copper, and finally oil. Is their current breather really such a surprise and reversal of fortunes? Absolutely not.
Summary
The bearish push in stocks has a good chance of finally materializing today. How strong will its internals be, will it entice the bulls to step in – or not yet? The stock bull run is firmly on, and there are no signals thus far pointing to an onset of a deeper correction with today‘s price action.
The gold bulls continue lagging behind their silver counterparts, predictably, with both under continued pressure. The yields are rising a bit too fast, taking the metals along – temporarily, until they decouple to a greater degree. Combined with the miners‘ signals, and unprecendented monetary and fiscal stimulus, unfolding real economy recovery, inflation making its way through the system, and the dollar struggling to keep its head above water, the new PMs upleg is a question of time.
Thank you for having read today‘s free analysis, which is available in full at my homesite. There, you can subscribe to the free Monica‘s Insider Club, which features real-time trade calls and intraday updates for both Stock Trading Signals and Gold Trading Signals.
Related: S&P 500 Correction Delayed Again While Silver Runs
The views and opinions expressed in this article are those of the contributor, and do not represent the views of IRIS Media Works and Advisorpedia. Readers should not consider statements made by the contributor as formal recommendations and should consult their financial advisor before making any investment decisions. To read our full disclosure, please click here.


