Obviously, there's a lot of time left on the 2021 clock, but value stocks are enjoying a resurgence – one that's strong enough as to illicit the oft-used “this time is different” phrase.
Using the S&P 500 Value and S&P 500 Growth indexes as the bogeys, the value vs. growth scoreboard reads up 9.8% to down 0.8% (as of March 10) in favor of value. Indeed, that is one logical reason why, after a lengthy slumber, value stocks are generating so much fanfare to start 2021.
Advisors are right to question the veracity of this value rebound. After, all they and their clients have been here before. Growth trounced value from 2007 through 2020, but over that span, there were plenty of occasions when value stocks perked up only to wind up getting taken to the woodshed by growth.
In other words, advisors are right to ponder the depth of the current value rally. The aforementioned S&P 500 Growth and Value benchmarks are domestic large-cap gauges, but as money managers well know, factors are applicable across all market capitalization spectrums and with international equities. That's important to remember because evaluating recent performance of value assets beyond large-cap U.S. equities can prove instructive in assessing the factor's 2021 performance and prospects.
Examining Depth of 2021 Value Rebound
Think of the recent value comeback in terms of a personal relationship. Beauty, in this case U.S. large-cap value, can get someone in the door, but, as the old saying, it's only skin deep. What's on the outside matters, but long-lasting, productive interpersonal relationships have depth.
As noted above, the depth comes from other value cases, be it domestic small-cap, international large-cap stocks and more. Fortunately, data confirm the 2021 value rally is checking the depth box.
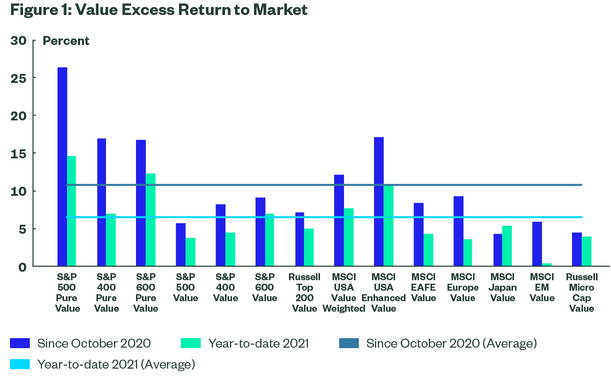
“The run-up in value has not been confined to one specific market, or construction philosophy,” says Matthew Bartolini, head of SPDR Americas research. “Fourteen different value approaches (ranging from sector neutral to small cap to emerging market) have outperformed their respective broad market segments both in 2021 and since the end of October – with the average excess return of 6% and 10%, respectively.”

Courtesy: State Street
As Bartolini points out, a hypothetical equally weighted portfolio of the value exposures seen in the chart above would generate excess returns of 4% of the rolling 90-day period. That's one of the best percentages for such a basket dating back to 1995.
Obviously, advisors should caution clients about getting too excited about one statistic, particularly one that pertains to a mythical portfolio, but the above percentage is some confirmation that the 2021 value rebound has the depth advisors want to see.
Not All About Sector Exposures
With the S&P 500 Value Index allocating over 27% of its combined weight to financial services and energy stocks, it's easy to assume there is some of sector dependency for the nascent value rally. That's not necessarily true.
As Bartolini points out, a sector neutral value strategy is performing admirably this year against a similarly constructed but non-sector neutral strategy.
“Similar to the analysis on the composite approach, the rolling 90-day returns show both value construction types have had outsized outperformance as of late, with the sector neutral exposure leading,” he wrote. “And the sector neutral exposure’s outperformance over the non-neutral benchmark indicates cheaper stocks are outperforming expensive stocks irrespective of the sector they reside in.”
That adds another layer of depth to the value thesis. And yes, this value rally appears to be broad-based enough that advisors may want to make time for the value factor in client conversations.


