

Trending

The 30 stocks in the Dow Jones Industrial Average highlight the good and bad of today’s markets.
I continue to be amazed by the Dow. Not by its historic rally since late March. That followed a 5-week, 33% selloff. But that’s not what amazes me about the Dow.
The Dow typically tracks the S&P 500 quite closely. Why is this just a bit remarkable? Because the Dow is 30 stocks, and the S&P 500 is, well, about 500 stocks.
This observation is not new to me, and maybe not to you either. The Dow and S&P 500 have been inter-changeable definitions of the “stock market” for a few decades now. For a long time, the Dow was the market to nearly all investors.
But these days, you see the S&P 500 cited just as often, if not more so. This is in large part because the financial services industry has pushed it on investors.
Why is the Dow still relevant?
The Dow “works” as a benchmark for a variety of reasons, but my interest in tracking it closely is for one specific reason. It is easier to get a sense of what the stock market is doing by reviewing the trends of 30 stocks than 500.
This table shows a big reason why the Dow is a fine market monitor but will be drowned out by Nasdaq-crazy periods in the stock market (like now). When you look at the Dow 30 instead of the S&P 500, you don’t get those behemoth stocks that don’t pay a dividend (Facebook, Google GOOGL +0.6%, Amazon AMZN +1%).
And with those and a few other Nasdaq NDAQ +0.6% giants roaring during the past decade, that is really the only thing in “large cap stock land” that the Dow doesn’t track quite well. Because those stocks are not in the Dow. They are practically an asset class by themselves.
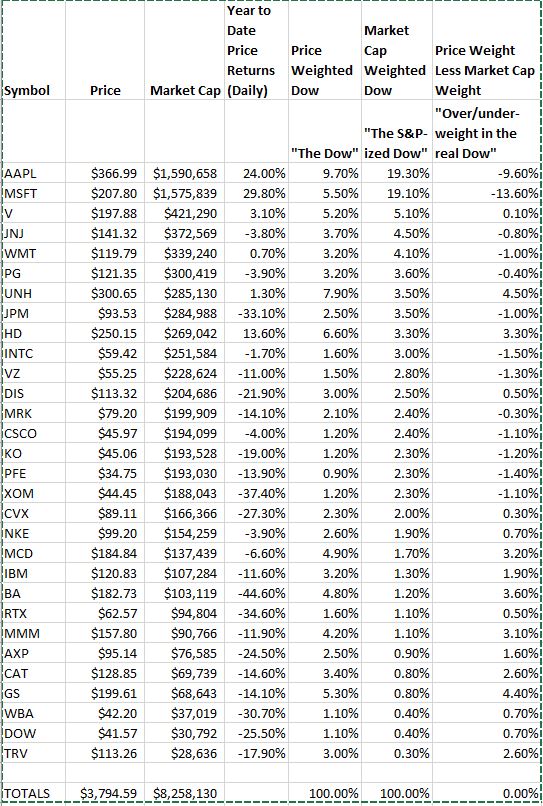
See both the actual weightings of the 30 stocks in the Dow (which is based on their stock price levels), versus my “re-imagined” Dow using the more common way indexes weight stocks. That is, based on their market capitalization (how much stock is out there).
2 stocks make a big difference
Note that the stock positions in the Dow that are larger weightings among the Dow 30 than they would be if the market cap approach was used, as the S&P does. In other words, if you just reshuffled the Dow 30 by market cap, you would get what I call an S&P-ized version of the Dow.
The key here is the two Dow stocks that are the most dominant now (Apple AAPL +1.6% and Microsoft MSFT +0.7%). Based on market cap, they would be nearly 40% of a market-cap tilted Dow index. THIS is the nature of why the stock market indexes look so puffed up.
Impact on today’s markets
The average stock in the S&P 500 is down about 11% this year. But if the index just keeps owning more and more of yesterday’s winners, that can drive the “headline” index up further and longer than any of us might expect.
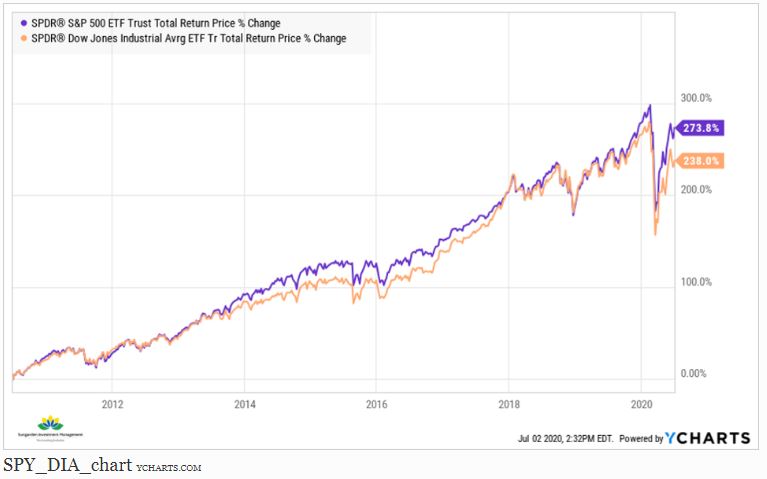
This has implications for the current market environment. During the first 6 months and 1 day of 2020, the S&P 500 was down 1.4%. The Dow was down by 7.7%. That is a high gap, but very explainable. A look inside the Dow shows us why.
This is very “dot-com-ish” to me, and I plan to continue monitoring it closely.
Related: The S&P 500 Is A Knucklehead, So Stop Treating It Like An Aristocrat