Price rules. Everything else is just talk.
Let’s see, now. There’s a pandemic, and people can’t gather in groups like humans naturally like to do. There’s massive unemployment. Congress is absent, literally and figuratively. There’s a U.S. election coming, and it’s getting nasty. There’s a growing number of global hot-spots, and I’m talking about politics, as well as the climate issue itself.
Consumer debt is high. But corporate debt may be higher. And government debt is way bigger than both. And that’s just the U.S. government. The rest of the globe has the same problem. It’s so bad that Europe appears to some to be the “healthy one” when it comes to economic outlook.
So, do you think the S&P 500 is up 20% since March, or 30%, or 40%? All are wrong. It’s more like 50%. And there has been little sign it will stop any time soon.
What gives?!
I analyze markets and make investment decisions for a living. An important part of that role is to separate what “should” be happening based on the world financial, economic and life condition, and what “is” happening. Because with all of the constant chatter from points north, south, east and west, a logical conclusion is this:
No one knows anything
We don’t tell the stock market what to do. Right now, the S&P 500 is being carried by a small number of very well-known stocks. That has created a mirage in one sense: the market as a whole is not doing nearly as well as the most popular indexes are.
But this is nothing new. It has been the case more often than not in the past few years. As I have pointed out here many times, it is very reminiscent of past market peaks, particularly that of the dot-com bubble in 1999-2000. But none of this solves the problem of determining whether the S&P 500 will set more new record closes. Nor will it tell us that another 5-week hellish drop is coming like it did in February and March of this year.
The only thing that matters
That’s enough about all of the things we can’t control. What we CAN control is the assessment of reward and risk potential, putting them side by side, and making decisions about how to balance between our own individual greed and fear. It is really that simple. What is less simple is what methods and tools you use to do that. For me, that part is actually the simplest.
Price is all that matters
To me, it’s all about the forces that push and pull the prices of not only the S&P 500 Index, but anything else that is priced in the liquid investment markets. What is something worth? Whatever someone is willing to pay for it.
And how do you handicap the many possible outcomes? You analyze price. To me, that means using technical analysis. However, you don’t use it in isolation. You use it in tandem in sizing up the world around us. Here’s what I mean.
What price tells us now
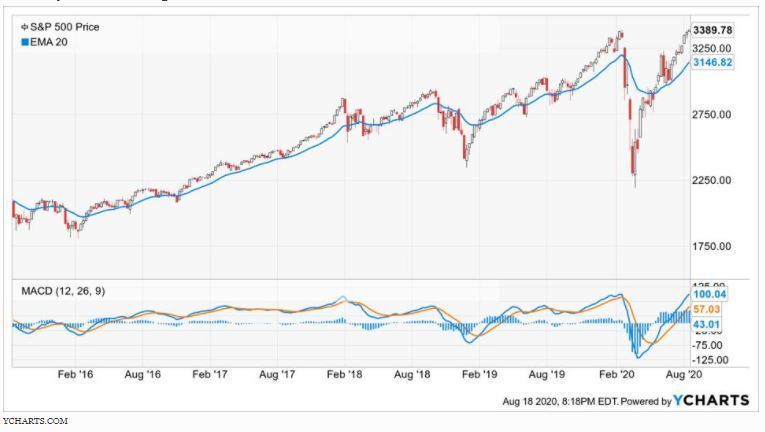
Here is a quick look at the S&P 500 over the past 5 years. I see 2 things on the chart that I would describe as “price is talking to me.” Don’t worry, I don’t mean literally. And, I am not clairvoyant. But I digress.

In the upper part of the chart, toward the right, we see that the 20-day moving average of the S&P 500 is rising. That alone would be a simple “we are in an uptrend” indicator. Now, it has been rising for a while, and has just about reached the level it hit in late February, just as the index was starting a 33% decline in 5 weeks. So, there’s that.
However, we can’t judge price that harshly. Sure, it is about to reach a level that was big trouble just 6 months ago. And, the market IS at all-time highs. Still, one of the first rules I learned in investing is that you never know how high price will go (second rule: you never know how low it will go).
And let’s face it, we are currently in the depths of summer. If the market languished for a while, then gravity set in during the autumn, it would hardly be the first time.
That is also around the time that many of the existing cross-currents I mentioned at the top of this article may come into greater focus. Again, price analysis is key. But analyze it in the context of the world around us.
Price keeps talking
The lower section of the chart has more “evidence” for us to collect to try to crack this case. There, we see that MACD (Moving Average Convergence-Divergence), a commonly-used indicator of price direction and trend, is flying higher. It, too, has reached its level from the February, 2020 peak. It is also not lost on me that this is higher than those which marked smaller market tops in early 2018 and again in late 2018.
Suffice it to say, the S&P 500 is overvalued. But that means nothing until price rolls over. Until that time, it’s a just a “pricey” market.
The bends
That means that we should be on guard for a significant pullback, but not assuming it. I recently saw a social media post that made me laugh. It said, “the trend is your friend until the bend at the end.”
In other words, enjoy the ride, but don’t be surprised when it ends. More importantly, don’t wait until that bend (breakdown in price) to start thinking about how you will adjust your portfolio’s positioning.


