
Trending

Forgive me for referring to the S&P 500 as analogous to “the market” in my headline. This is one of my pet peeves, because the Market is a much broader thing than one broad-based stock index. It is really every investable asset, in my opinion. However, I recognize that many people, when thinking about the S&P 500, take it as a proxy for “the market.” Blah, blah, let me get on with it.
A Common Fiction: the market is getting more efficient
There is a riff and refrain in the investment management industry that “the market” is getting ever more efficient. That AI algorithms trade away any alpha rapidly. That information moves so much faster now. That databases cover way more factors than ever before, and so on. In other words, it is getting harder and harder to beat the market. I hear that. However, I disagree. Here’s why…
The academic version of what constitutes market efficiency sounds something like, “as news hits, how quickly is that information absorbed into prices?” Academics like to define efficiency with such a narrow time horizon because without that then the statistical significance they crave fades with time. That usually results in papers that do not qualify for publication.
If you are a long-term investor (3+ year investment time horizon) then it is highly unlikely that you respond to the kind of news that is quickly absorbed into prices on an hourly, or daily, or weekly basis. Maybe even monthly prices do not move you to action. There is a logic here for a fundamental investor. Namely, the operating environment for every business is vast and a large number of variables may effect the value of the business. But all businesses are opportunity and threat absorption machines adapting to a changing, hyper complex environment, and in real time. So, sans news with large scale effects, efficiency is best measured in another way.
A Different Way of Measuring Efficiency
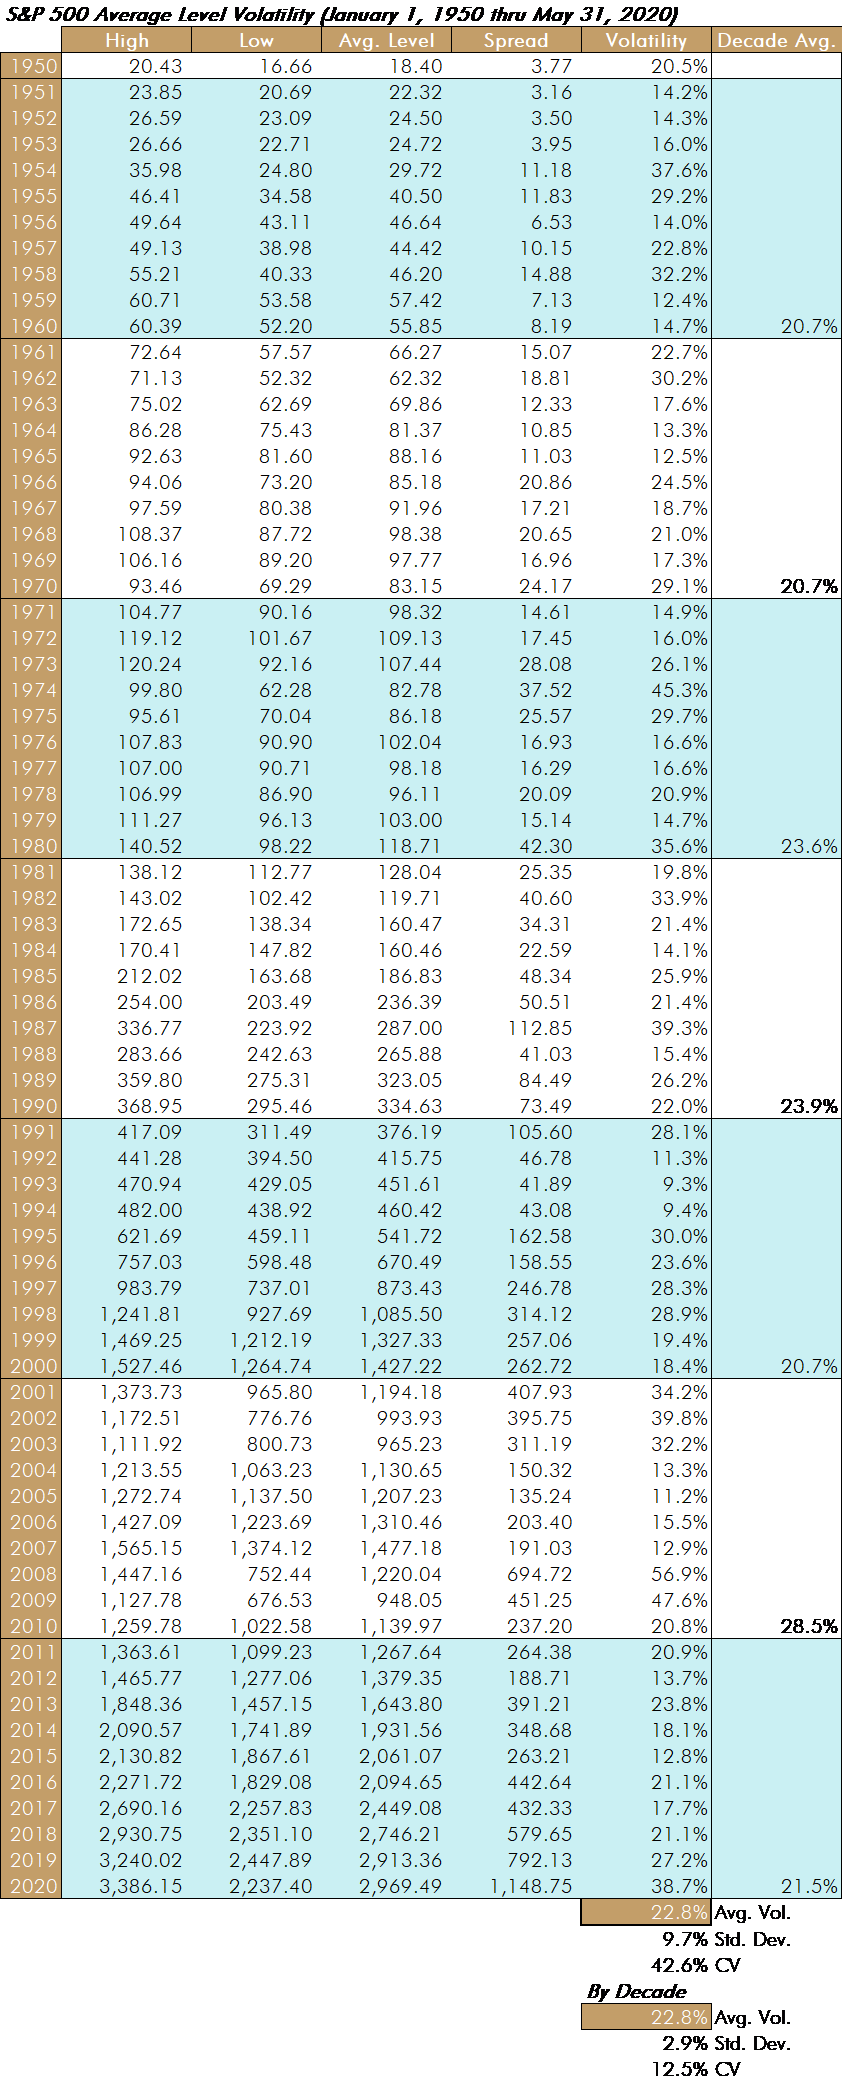
One of my favorite annual data series I track is the spread of the high and low levels of the S&P 500 in a year, divided by its average level for the year. In other words:
S&P 500 Level Volatility = (S&P 500 Yearly High – S&P 500 Yearly Low) ÷ Avg. Level of S&P 500 for the year
I think I invented this, but I am certain someone else tracks this, and has tracked this, over the years. Nonetheless, I have used this for a long time to demonstrate that the stock market is not efficient. Why?
Since 1 January 1950, the average S&P 500 level volatility is 22.8%. That means, from the perspective of the market every company in the S&P 500 fluctuates in fundamental value by 22.8%. Let us compare this fluctuation to the on-the-ground reality by asking a rhetorical question. Does the value of the average company’s prospects, operations, assets, and management fluctuate by this much each year, on average?
Said another way, if we had omniscience and omnipotence and had perfect transparency and understanding of the value of each company in the S&P 500 would we find that the actual, fundamental value fluctuated by almost 25% each year. No way! I bet most of you agree with me. What that volatility means is that the market value bounces all over the place and that a high quality estimate of fair value ought to be able to find a place to buy shares that would deliver alpha.
Important Observations
This is why I conclude three things:
- The S&P 500 is not efficient in the way that really matters for fundamental investors: measuring the actual value of the business.
- There remains a large opportunity for fundamental investors who do have a firm grip on fundamental value to take advantage of these price fluctuations.
- Active investment management is underperforming, not due to market efficiency, but due to something else.
The Data
Here is the entirety of the (I think, fascinating) data series for the S&P 500…
Conclusion
Look at the consistency of the Level Volatility by decade numbers. Just eye-balling it you can see the consistency. It is right around 22%, and with a very low coefficient of variation of just 12.5%. If you get rid of the obvious outlier decade, the ‘00s, then the coefficient of variation drops to just 7.0%. In other words, it is no more difficult now than in decades prior to earn active returns if what you are relying upon is an understanding of fundamental value that differs from market value.
I make my living as a consultant, not as a writer. My job is to help you and your investment team get better. So, contact me to learn how all of these insights can be integrated into what you do.