
Trending

Stocks went lower on Tuesday following the failed attempt at extending their last week’s rebound. Is the market poised to break below the recent low?
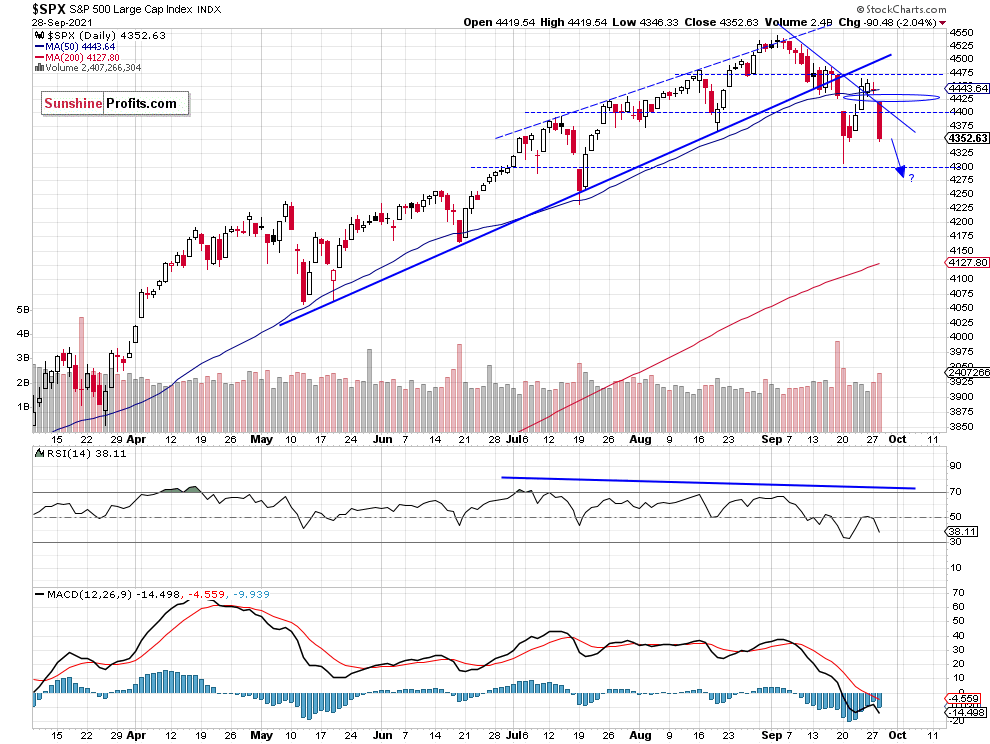
The S&P 500 index retraced most of its recent advance on Tuesday, as it lost 2.04%. It followed the strengthening U.S. dollar and rising bond yields. One and a half week ago, it fell the lowest since July 20, as it reached the local low of 4,305.91. It was 239.9 points or 5.28% below the September 2 record high of 4,545.85. Then it has been bouncing and on Thursday it reached a local high of 4,465.40. So yesterday’s decline may look like resuming of the downtrend. However, this morning the market is expected to open slightly higher and we may see an intraday consolidation.
The nearest important support level of the broad stock market index is now at 4,440-4,450, marked by the recent local low. The next support level is at around 4,300. On the other hand, the resistance level is at 4,400 again. The S&P 500 got back below its month-long downward trend line, as we can see on the daily chart (chart by courtesy of http://stockcharts.com):
Dow Jones Failed to Break Above 35,000
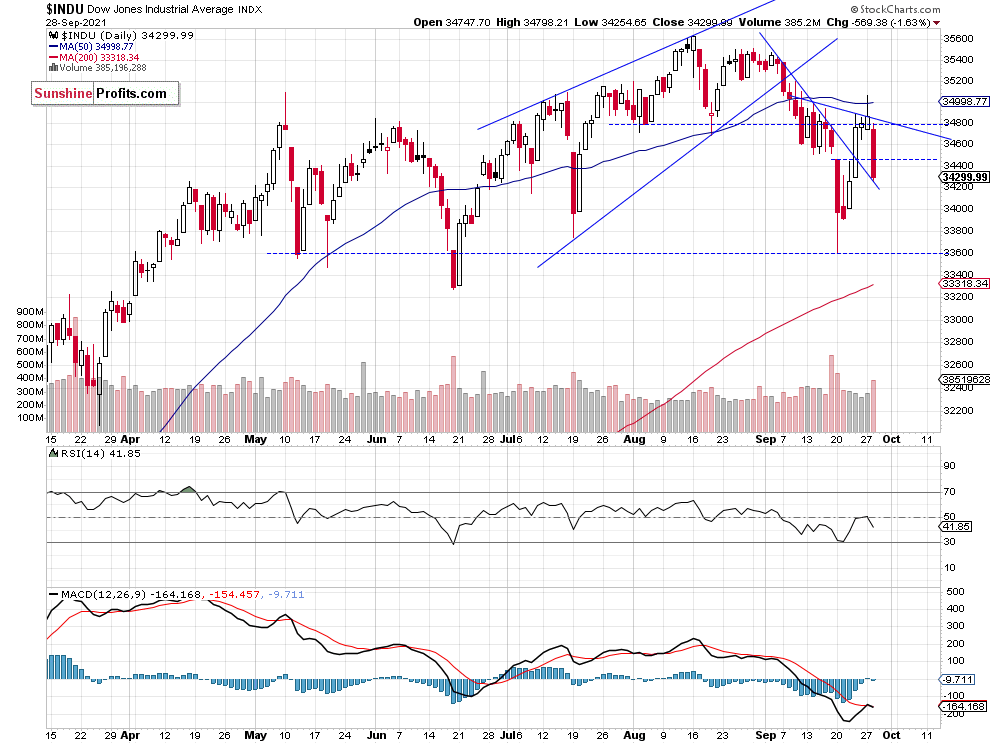
Let’s take a look at the Dow Jones Industrial Average chart. In early September the blue-chip index broke below a two-month-long rising wedge downward reversal pattern. Last week it has bounced from the 33,600 price level up to around 35,000. But yesterday it got back below 34,500 level again, as we can see on the daily chart:
Apple Is Back at Lows
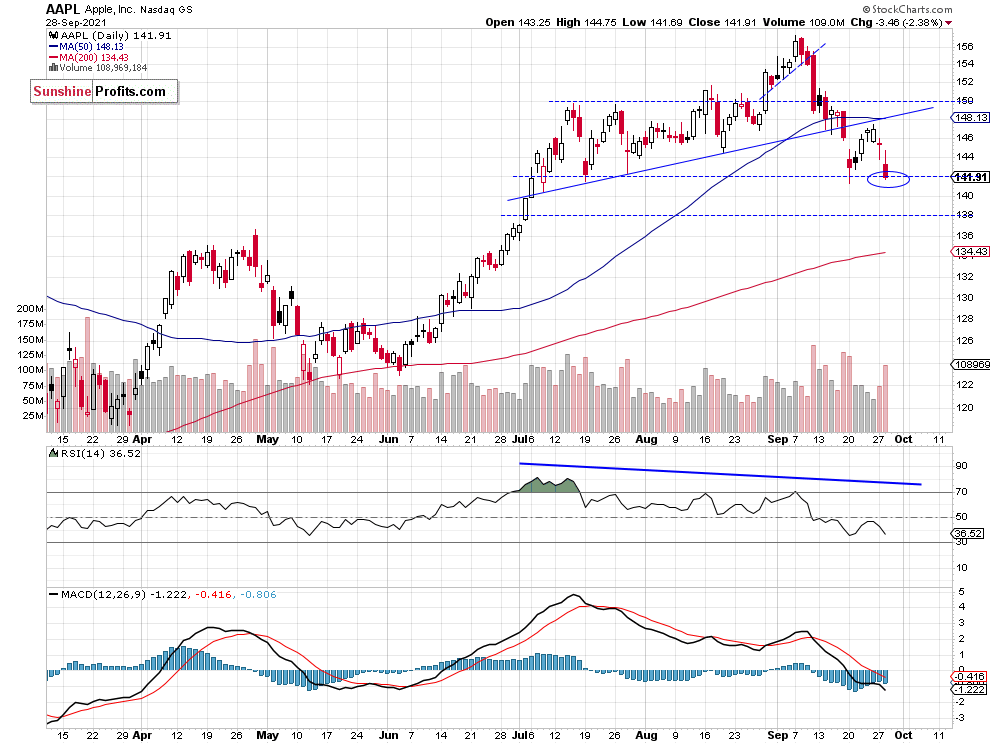
Apple stock weighs around 6.3% in the S&P 500 index, so it is important for the whole broad stock market picture. In early September it reached a new record high of $157.26. And since then it has been declining. So it looked like a bull trap trading action. On Monday a week ago the stock sold off to the previous local lows along $142 price level. It acted as a support level and the stock bounced to the broken upward trend line. Yesterday Apple led the broad stock market lower, as it fell 2.4%. Right now the price is sitting at the support level of its previous lows. So it is another “make or break” situation.
Conclusion
Since last Tuesday we’ve witnessed a short-covering rally fueled by the Wednesday’s FOMC Monetary Policy release. But it was just an upward correction within a downtrend and the S&P 500 index’ mid-September short-term consolidation acted as a short-term resistance level.
There have been no confirmed positive signals so far. Therefore, we think that the short position is justified from the risk/reward perspective.
Here’s the breakdown:
- The S&P 500 accelerated its downtrend a week ago, as it got close to 4,300 level. It retraced some of the decline last week, but yesterday’s price action was very bearish again.
- Our speculative short position is still justified from the risk/reward perspective.
- We are expecting more downward pressure and a correction to 4,200-4,250 level.
Related: How Do You Get Inflation Under Control?
The views and opinions expressed in this article are those of the contributor, and do not represent the views of IRIS Media Works and Advisorpedia. Readers should not consider statements made by the contributor as formal recommendations and should consult their financial advisor before making any investment decisions. To read our full disclosure, please click here.