
Trending

Written by: Monica Kingsley
Just as I called for, the bulls are winning in the battle to break above the early June highs lastingly. And it's not through technology, communications or the defensives – the other sectors keep more or less standing ground.
So, can I wave off the selling pressure right after the opening bell? In today's analysis, I will look at this shot across the bow, and examine the extent to which the bulls should be concerned, or not.
I reaction to Q2 tech earnings indeed overpowered the dismal quarterly GDP figures and struggling job market. Right or wrong, the stock market takes a rear view mirror look at this historic GDP plunge, treating it as a mere mini-depression. It chooses to ignore the fact that more than 54 million Americans have filed new claims for unemployment benefits, and that a total of 118 million working age Americans aren't working (the labor participation rate in June stood at 61.5% only).
With the new stimulus around the corner, it's betting that the unprecedented plunge in personal consumption (concentrated in services, not goods) and likewise steep dive in consumer sentiment, would be over. Right now, such bets are still paying off.
S&P 500 in the Medium- and Short-Run
I’ll start today's flagship Stock Trading Alert with the weekly chart perspective (charts courtesy of http://stockcharts.com):
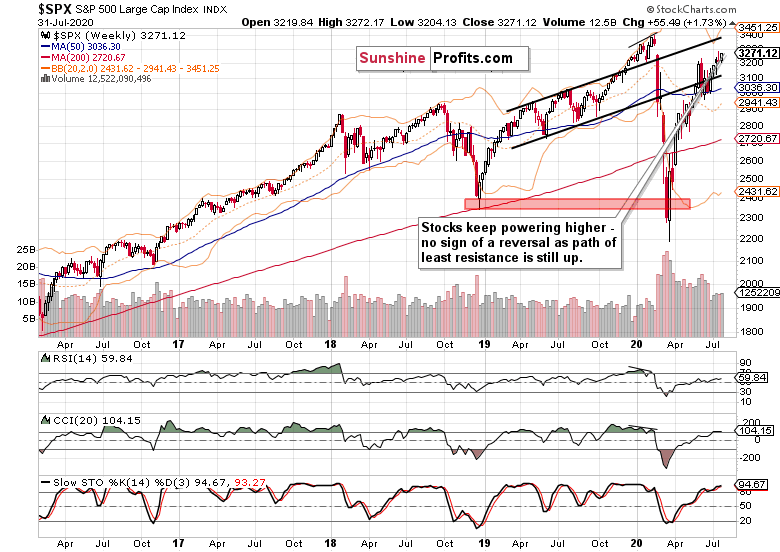
After preceding week's hesitation, bullish price action revived the weekly chart again. On solid volume, prices closed above the early June highs. All by themselves, I don't see the extended weekly indicators as a cause for concern – such rationale has to stem from the daily chart, so let's check that one next.
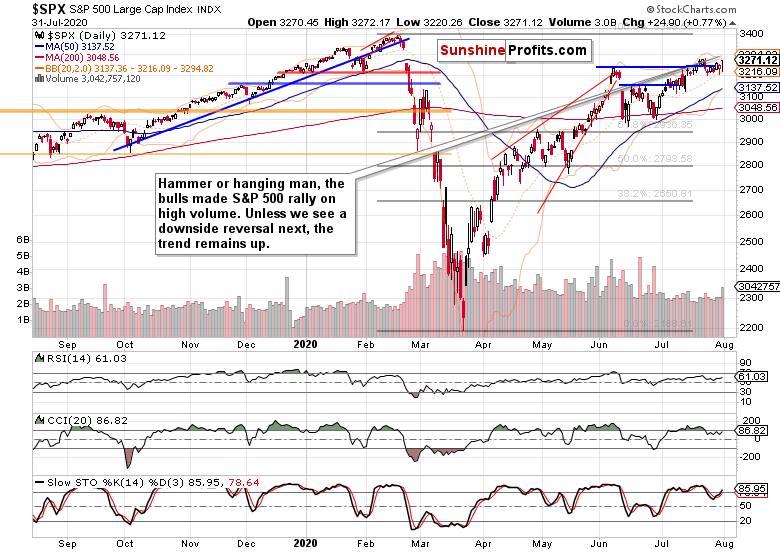
Another breakout attempt above the early June highs is officially in, and its rising volume is encouraging. Or does the bearish candlestick bring more than its fair share of caution? Without a downside reversal in the nearest days, the candle merely tells a story of a successful reversal of Friday's losses.
The credit markets still lean the bullish way.
The Credit Markets’ Point of View
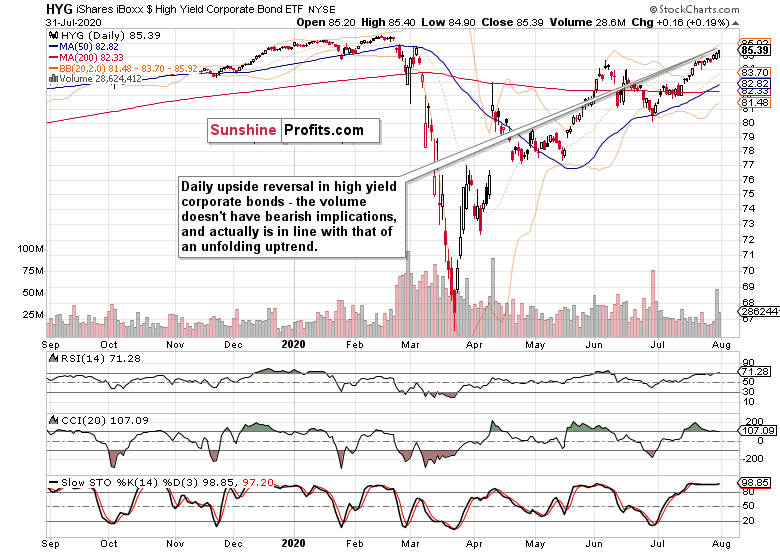
High yield corporate bonds (HYG ETF) extended gains on Friday, having earlier repelled the bears. The lower volume isn't an issue when examining the previous volume spike. Take a look at late June, and the relative volume differential in the session following the washout one. That's why I see Friday's decreasing volume vs. Thursday's high one, as no cause for concern.
Both the leading credit market ratios (please see this and many more charts at my home site) – high yield corporate bonds to short-term Treasuries (HYG:SHY) and investment grade corporate bonds to longer-dated Treasuries (LQD:IEI) – are broadly supporting each other. And that bodes well for the stock upswing to go on.
The ratio of high yield corporate bonds to all corporate bonds (PHB:$DJCB) is in an uptrend again, and such return of the animal spirits in bonds is constructive for the stock market bulls.
The ratio of stocks to Treasuries ($SPX:$UST) paints a bit more cautious picture. Yet, its message is still of the stock bulls enjoying the benefit of the doubt.
The overlaid S&P 500 closing prices (black line) against the HYG:SHY ratio show that Friday's close didn't leave stocks in a dangerously extended position. Should the HYG:SHY tailwind last as I see it likely to, then stock prices have a floor nearby.
Smallcaps and Emerging Markets
The Russell 2000 (IWM ETF) is trading weak on a very short-term basis – it didn't manage to even close unchanged while the S&P 500 moved up. Should they have performed better, that would point to a more broad-based advance within the S&P 500 – and indeed, the daily market breadth indicators in the 500-strong index have seen better days, politely put. But back to smallcaps.
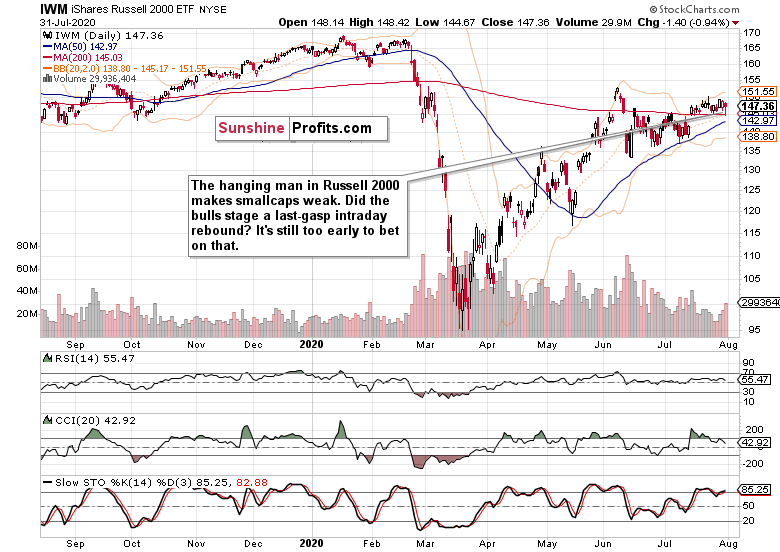
Indeed, the IWM ETF is in a vulnerable position after having defended its 200-day moving average. Should its weakness take a more impactful turn, that would surely affect the S&P 500.
Emerging markets keep their healthy consolidation going, and are slowly again approaching their early July highs. This chart's message certainly isn't bearish for the S&P 500.
S&P 500 Sectors in Focus
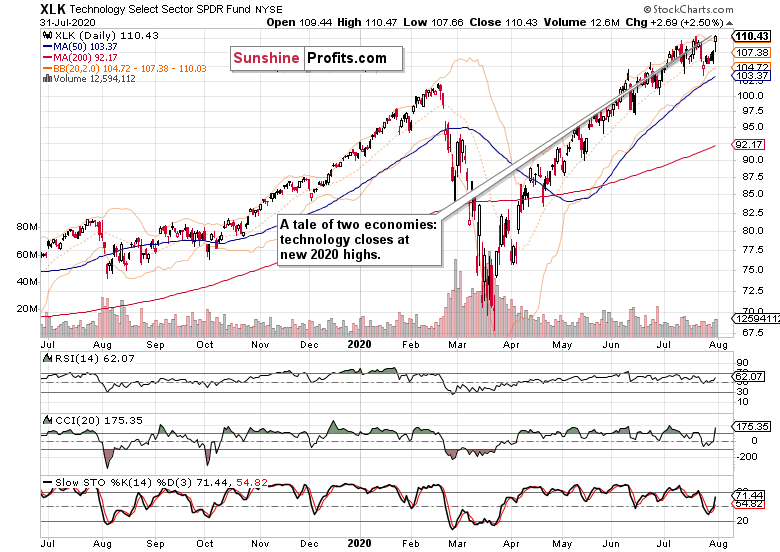
Technology (XLK ETF) is all the rage again, making new 2020 highs. Pretty extended, but the much talked about correction, hasn't come and isn't really here. The key driver of Friday's S&P 500 isn't disappointing.
Crucially, semiconductors (XSD ETF) aren't underperforming in any dramatic fashion. Dramatic – that's an understatement, because one day's weakness doesn't cut that. Move on, no crack in the dam here.
Healthcare (XLV ETF) merely refused to decline profoundly on Friday, and isn't really acting as a market leader over the past few session. Step aside though, and the chart is healthy, and I look for an upside surprise here quite soon. Perhaps some more vaccine news slash hype would help the lackluster financials (XLF ETF) performance too.
Summary
Summing up, Friday's S&P 500 reversal is keeping the breakout attempt above the early June highs alive. Credit markets keep acting strong, and the rise in Treasuries just serves to power the TINA (there is no alternative) trade as it pushes investors farther out on the risk curve. Farther than they would be comfortable, but still helping the stock bull at the moment. One of the key watchouts is the daily market breadth, where both the advance-decline line and advance-decline volume remain in the bearish territory. Overall, the balance of risks remains skewed to the upside, though the bulls would benefit from a tight stop-loss locking recent gains.