
Trending

Mid-cap stocks are having a decent year in 2021. Year-to-date, the S&P MidCap 400 Index is higher by almost 16%, giving it a narrow advantage over the large-cap S&P 500 while trailing the S&P SmallCap 600 Index.
Some clients may think 2021 is just another year in the life for mid caps being stuck in, well, the middle and not doing much to generate adulation and buzz. Advisors know better. In fact, not only are mid-cap stocks dynamic generators of impressive returns over long holdings periods, stocks in the middle offer clients another pleasant surprise: A surprisingly amount of resilience when markets turn sour.
A new report by State Street Global Advisors (SSGA) analyzes the performance of mid-cap equities during the three major systemic risk events spanning the 1994 through 2020 period. Those being the Asian currency/Russian financial crisis, the bursting of the dot-com bubble and the global financial crisis.
Those events led to bear markets in the more traditional sense in terms of depth and length of time so for those wondering why the SSGA analysis doesn't include the coronavirus bear market of 2020, I can't say for sure, but it's likely because that was an unusually short bear market. For those keeping score at home, mid caps did beat small-cap stocks last year.
“And — perhaps due to the market’s significant deterioration at the outset of the pandemic — mid caps did experience larger drawdowns than did large caps in 2020. However, from the market bottom of 2020 through the end of the year, mid caps rallied much harder than both large and small companies and delivered returns of 99% versus 75% for large caps and 97% for small caps,” according to SSGA.
Examining the Mid-Cap Surprise
Mid caps are often lumped in the phrase “smaller stocks.” To a certain extent, that's accurate because mid caps certainly are smaller than their large-cap rivals.
However, advisors should impart upon clients that smaller doesn't mean the elevated levels of volatility that usually accompany small caps. Actually, the drawdowns of mid caps during the three aforementioned systemic events were surprisingly less severe than other market segments.
“During the three systemic risk events under consideration, mid-cap stocks experienced smaller drawdowns than either large- or small-cap stocks, and they also took less time to recover,” notes SSGA. “These findings run contrary to two common beliefs: that shares of the largest firms hold up the best in a downturn due to their greater resources and more-mature business models, and that shares of more domestically oriented, nimble, 'risk-on' small caps are the fastest to recover after the market turns up.”
SSGA also pondered the possibility that mid caps smaller drawdowns and superior rebounds may be the result of sector attribution. Given that the S&P MidCap 400 allocates about half its weight to industrial, consumer discretionary and financial services stocks – cyclical sectors – it stands to reason that mid caps would outperform the other segments coming out of a recession. There might be something to the sector attribution argument.
“Mid caps had the smallest or second-smallest drawdown 23 times and experienced the fewest instances with the largest drawdown (five),” said SSGA. “Mid caps had the fastest or second-fastest recovery time 25 times and experienced the fewest instances with the longest recovery period (three).”
Rethinking Mid-Cap Allocations
Obviously, advisors know that a one-size-fits-all approach to market cap spectrums cannot be used with clients. Older clients should probably have lower exposure to smaller stocks while millennial and Gen Z clients should have more exposure to mid and small caps.
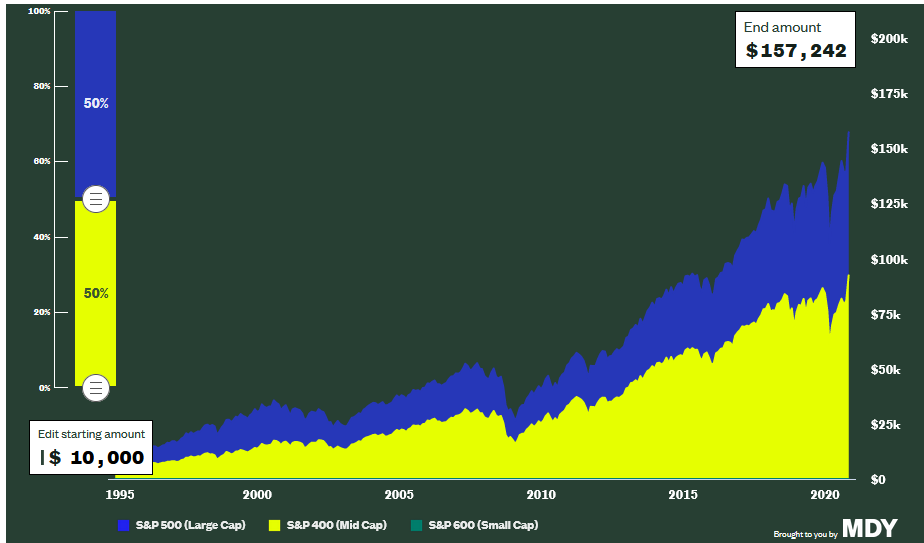
It is also clear, however, that many portfolios are under-allocated to mid caps. Some visualization as to why that needs to change should help. SSGA makes it easy with the link I'm including here. Advisors can tinker around and see what a $10,000 portfolio split at varying percentages among large-, mid- and small-cap stocks from January 1995 through November 2020 would have delivered.
In the chart below, I eliminated small caps from the equation, going 50% mid and 50% large. My mythical $10,000 turned into $157,242. That's about 4% better than a 40% large/30% mid/30% small split. Altering that mix to 20% mid caps and 40% small caps would have cost clients almost $10,000 compared to my 50/50 portfolio. Perhaps it's small caps that should be getting less attention.
Courtesy: State Street Global Advisors
Related: Answering Client Questions About Energy Income Assets