
Trending

It depends which S&P 500 you are talking about. How to sort out a narrowing market.
What is “the stock market” to you? For many investors, the S&P 500 is how they characterize how stocks are performing. Based on that, you can make the case that the stock market is sitting around all-time highs. Or, you can conclude that it peaked about3 months ago, and has topped out for a while.
How can this be? There’s an old joke about asking 5 economists to make a forecast, and you get 9answers. But in the case of the current stock market environment, we have yet another reminder that the S&P 500 you hear in news headlines is far from the only way to characterize the stock market. In fact, it doesn’t even tend to explain itself! Allow me to explain.
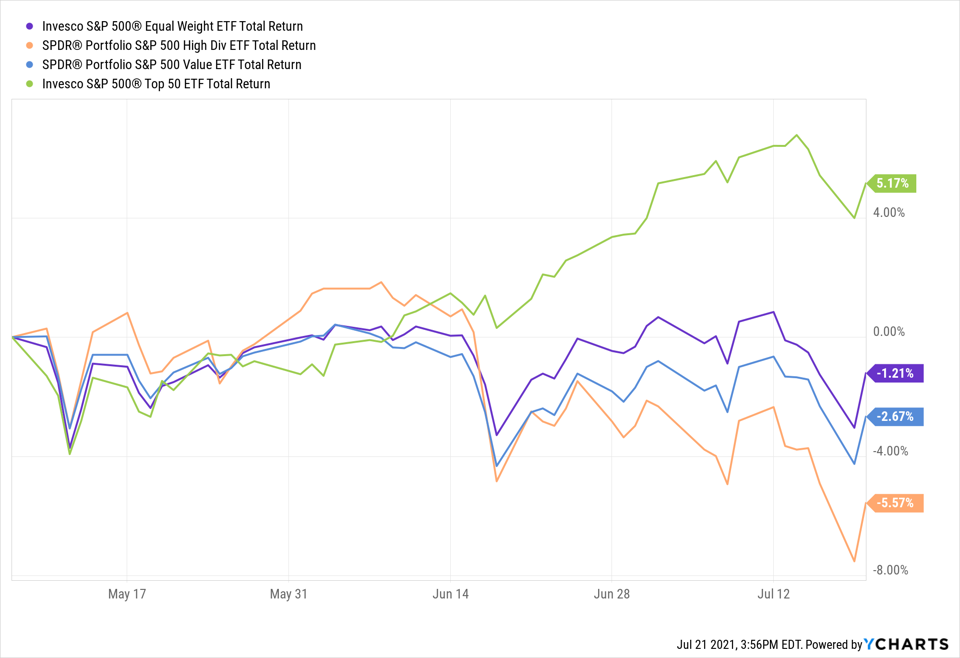
The chart above shows 4 ETFs which are based on indexes that track the S&P 500. The difference between them is the swath of that index they seek to emulate. In other words, as is often the case, today’s market is truly heading in multiple directions at the same time. And, since May 7 of this year, most of those market slices are heading south.
Sorting out the S&P 500
The average S&P 500 stock (purple line) is slightly off its May high. Value stocks within the S&P 500 (blue line) are down too. Most prominently, stocks of higher dividend companies (orange) within the S&P 500 were nearly 8% off their May highs, before the recent bounce-back.
So, where, if anywhere is the strength in the market since May? It is where it has been in recent years, and where investors tend to go when the investment climate gets murky. That is, the largest stocks. These are both the ones that occupy dominant positions in their industries, and in most cases, have also gone up the most in price in recent years (based on market capitalization, not price percentage gain).
You can see this in the chart because the green line has moved in the opposite direction of the others recently. That ETF represents the 50 largest companies in the S&P 500. The good news is that investors still see these businesses as stalwarts, capable of masking the weakness in the overall stock market. The bad news is that this is taking a very unhealthy misunderstanding among investors of all types, and making it worse. There are likely investors frustrated with their stock market performance in recent years. That’s what happens when one segment of the market (the giants) dominates.
The silent majority (of 450 stocks out of 500)
As for investors who tend to focus more on long-term fundamental valuation, dividend yield and the concept of holding roughly equal amounts of each stock you own? They are feeling understandably disappointed. Not because there is anything wrong with how they are approaching their investments. Rather, its because they are not getting the current “thrill” that investors in the more popular, capitalization-weighted S&P 500 have been feeling since the market bottomed over a year ago. Those 500 companies have been mis-represented by the crowded group at the top in terms of market value.
This top-heavy market can go on for a while. But every time the other 450 stocks within the S&P 500 show cracks as they are doing currently, every investor should take notice.
Related: Having a Bear Market Game Plan Will Set You Apart From Your Competitors