
Written by: Eric Snyder | New York Life Investments
The economic uncertainty ignited by the coronavirus outbreak sparked a flight to quality and unparalleled levels of cash flowing out of risk assets and into bank accounts, CDs and money market funds. Many investors, fearful of the impact of market volatility, chose to sacrifice return for asset classes that they believed provided a safe haven. As many investors start to get off the sidelines and back into assets with greater return potential, it’s our perspective that these investors can find an optimal risk-return balance in short-term municipal bonds.
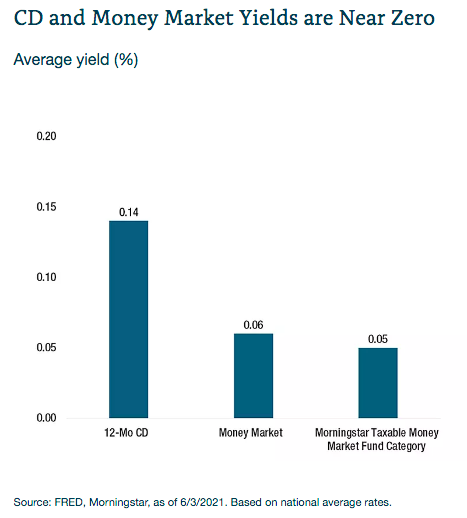
The cash conundrum: cash assets going up, and yields going lower
Since the start of the global pandemic in 2020, the shift to cash and other safe-haven assets has been dramatic. Federal Reserve data shows that about $2 trillion was deposited into bank accounts during 2020.1 In April 2020 alone, bank deposits grew by $865 billion, a number that eclipsed cash deposits in any previous year.2 Investors also poured about $1.1 trillion into taxable money market funds over the period from January 2020 to April 2021, according to net flow data from Morningstar.3 By the end of 2020, total money market fund assets ballooned to nearly $4.3 trillion, a $700 billion increase compared to a year prior.4
This rush to safety occurred even as the Federal Reserve (Fed) lowered the federal funds rate down to a range of 0% to 0.25% on March 16, 2020. This, of course, occurred as the impact of the pandemic was becoming clearer and de-risking in the financial markets was already underway.
While aimed at stabilizing the economy, the Fed’s actions also lowered yields on bank deposit accounts, CDs and money market funds. As investors began shifting money into these low-risk assets, rates of return were dropping, making it increasingly difficult for investors to find meaningful returns in the short-term markets.
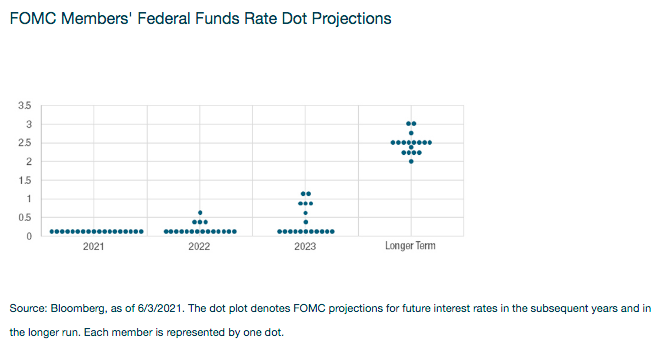
Moreover, the Fed has continually made clear the future of the rate environment, as evidenced by Chair Powell’s comment during an April 2021 television interview: “I think it's highly unlikely that we would raise rates anything like this year.”5 With the unlikelihood of moving beyond near-zero rates before 2023, investors have adjusted expectations, as they should.
Short-term Interest Rates are Projected to be Near Zero Through the end of 2022
Why short-term munis now?
The velocity of the municipal sell-off in March 2020 was the worst in decades. However, it’s important to note that many short-term and ultrashort bond funds also did not meet investor expectations during the height of the volatility. These asset classes are often viewed as a notch up the risk spectrum from cash, CDs and money market funds, but they performed poorly throughout the March volatility.
Investors May Have Been Disappointed by the Average Short-Term Bond Fund or Ultrashort Bond Fund
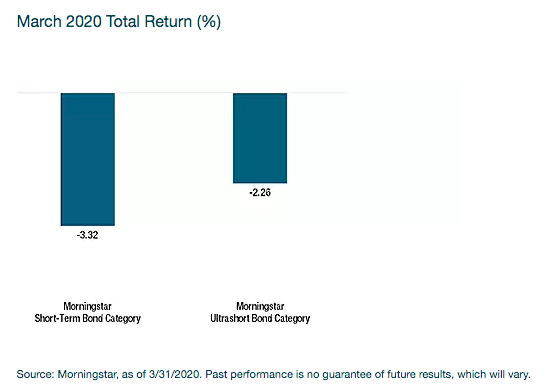
By comparison, three-year short-term investment-grade municipal bonds (short-term municipals) offered more limited downside participation in March 2020, returning -1.37%, not adjusted for taxes. When adjusting for the tax benefit, that return increases to -1.06%, representing outperformance of +226 bps and +120 bps over the average taxable short-term bond fund and average ultrashort bond fund, respectively.6 Even the average short-term municipal mutual fund, as represented by the Morningstar Muni National Short category, fared better in March, posting a return of -1.59% (not adjusted for taxes). These results aren’t surprising when taking into account the key traits of short-term municipal bonds.
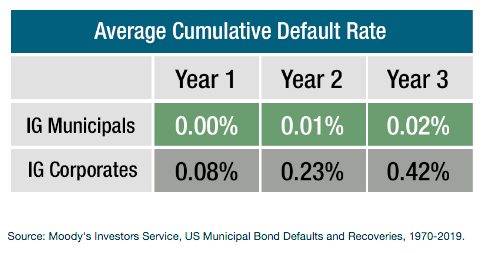
- Short-term municipal bonds have historically had low volatility. This can be attributed to the minimal credit risk inherent in these securities, especially when compared to global short-term corporates. For example, the three-year average cumulative default rate for investment-grade municipals from 1970-2019 was 0.02%, while investment-grade corporates had a 0.42% default rate. In other words, corporates had a 21x greater chance of defaulting compared to municipals.7
- Additionally, the muni market has historically skewed toward the highest credit ratings. At year-end 2019, roughly 92% of Moody’s-rated municipal credits were rated A or higher. Meanwhile, the median municipal rating was Aa2, while the median rating for global corporates was Baa2.8
Municipals Rarely Defaulted, Especially Relative to Short-Term Corporate Bonds
While some investors may be overlooking the benefits of an allocation to short-term munis in this environment, we believe that, when considering the yield per unit of risk, munis provide the best “bang for the buck” over short and ultrashort corporate bond alternatives.
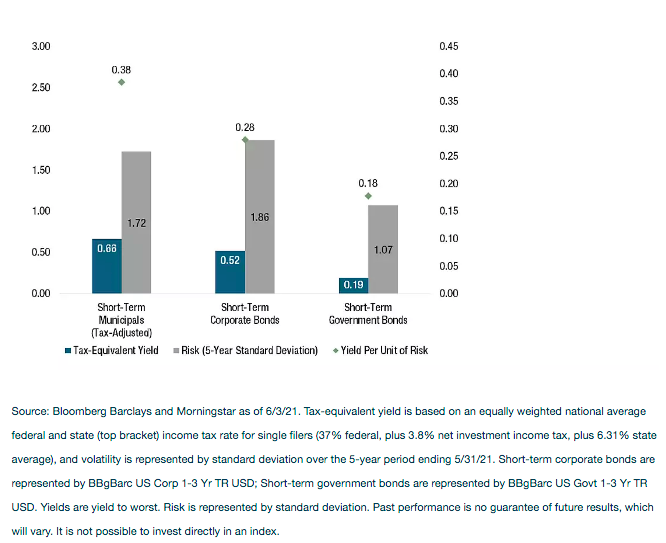
Why is this the case? Well, short-term corporates and government securities are widely held in short-term and ultrashort bond portfolios (the combined average exposures for the Morningstar Short-Term Bond Category and Morningstar Ultrashort Bond Category were 68% and 51%, respectively, as of 4/30/2021). Accounting for the tax benefit of municipal bonds, short-term municipal bonds have a yield of 0.66%, which currently exceeds both short-term corporate bonds (0.52% yield) and short-term government bonds (0.19% yield). From a relative volatility perspective, short-term municipal bonds fall between corporates and governments.9 We pointed out above that corporate bonds carry more historical credit risk, but what about government bonds?
Looking under the hood of the Short-Term Government Bond Index, you’ll see it is composed mainly of AAA-rated U.S. Treasuries (approximately 95%), with interest and principal payments backed by the full faith and credit of the U.S. So, while short-term government securities have very low volatility, they are also very sensitive to market interest rates, and even a slight uptick in rates could wipe out a year or more of coupon income. Thus, the government sector could be the most challenged of the three in a rising interest rate environment. This is why the short-term municipal asset class currently offers the best yield per unit of risk taken.
Short-Term Municipals Offer the Best Yield-per-Unit of Risk Versus Key Short-Term Fixed-Income Sectors
Concluding thoughts
So, what exactly does all of this mean for investors going forward? Well, first and foremost, it is clear that investors should be giving more consideration to short-term municipal bonds as a solution for stepping out of cash. Yields on certificates of deposit and money market accounts and funds are near zero and the typical asset classes for the job (i.e., short-term taxable bond sectors) currently lack the risk-return balance that investors may want in this type of allocation.
Short-term municipal bonds, however, provide high credit quality with lower credit risk compared to taxable corporate bonds. We continue to believe that municipal bonds should be part of a diversified asset allocation, and that the current environment has made active management more important than ever. By taking advantage of the price weaknesses, rate changes and market dislocations, active muni bond managers remain best positioned to outperform during these extraordinary market conditions.
Related: 5 Common Misconceptions About Inflation
1. Board of Governors of the Federal Reserve System (US), Households; Checkable Deposits and Currency; Asset, Level [BOGZ1FL193020005Q], retrieved from FRED, Federal Reserve Bank of St. Louis; https://fred.stlouisfed.org/series/BOGZ1FL193020005Q, June 3, 2021.
3. Source: Morningstar Direct as of 4/30/21
4. Board of Governors of the Federal Reserve System (US), Money Market Funds; Total Financial Assets, Level [MMMFFAQ027S], retrieved from FRED, Federal Reserve Bank of St. Louis; https://fred.stlouisfed.org/series/MMMFFAQ027S, June 3, 2021.
5. https://www.cnbc.com/2021/04/11/powell-says-its-highly-unlikely-the-fed-will-raise-rates-this-year-despite-stronger-economy.html
6. Short-term municipals represented by Bloomberg Barclays Municipal 3-Year Index. Tax-adjusted return based on an equally weighted national average federal and state (top bracket) income tax rate for single filers (37% federal, plus 3.8% net investment income tax, plus 6.31% state average).
7. Source: Moody’s US Municipal Bond Defaults and Recoveries, 1970-2019.
8. Source: Moody’s US Municipal Bond Defaults and Recoveries, 1970-2019.
9. Short-term municipals: Bloomberg Barclays Municipal 3-Year Index; short-term corporates: Bloomberg Barclays U.S. Corporate 1-3 Year Index; short-term government: Bloomberg Barclays U.S. Government 1-3 Year Index. Volatility is represented by 5-year standard deviation from May 31, 2016 – May 31, 2021. Past performance is no guarantee of future results, which will vary. It is not possible to invest directly in an index.