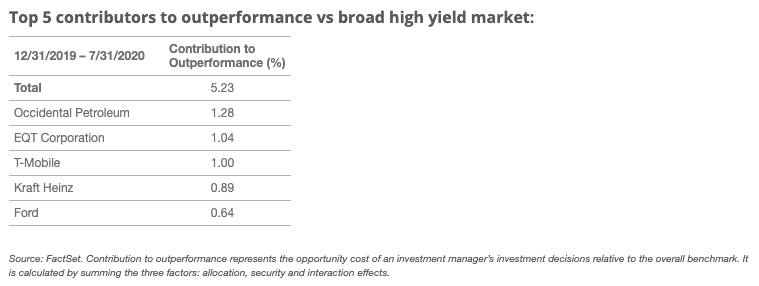
Fallen angel bonds, as represented by the ICE US Fallen Angel High Yield 10% Constrained Index (“Fallen Angel Index”), are outperforming the broad U.S. high yield market, as represented by the ICE BofA High Yield Index (“High Yield Index”), year-to-date by 5.23% as of July 31, 2020.1 This year’s new fallen angels are the primary drivers. As we have noted previously, outperformance versus the broad high yield market historically follows periods of high fallen angel volume, and this year has not been an exception. With over $140B of new fallen angels so far this year, it is already a record year, and we expect more fallen angel volume going forward.2
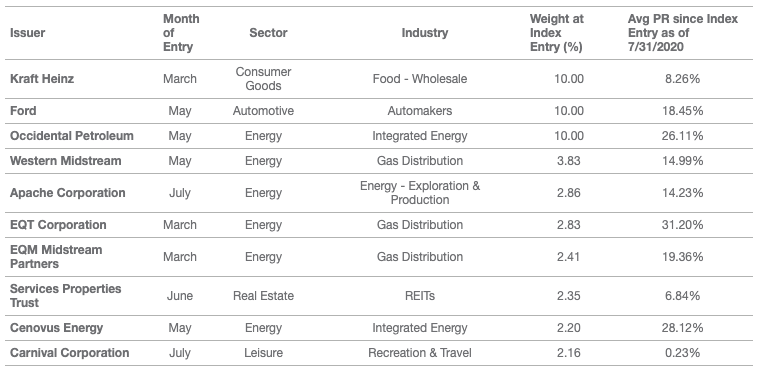
From an issuer standpoint, four of the top five contributors have entered this year, including Occidental Petroleum, Ford and Kraft Heinz.

There are three main explanations for this outperformance:
1. The fallen angel technical effect: This has been more pronounced this year as the average six-month price return prior to entering the index for all 2020 fallen angels YTD is ~-18%, which is more than twice the historical average (~-7%).3 Within six months of entering the index, the new fallen angel bonds prices tend to recover and usually go back to where they were six months before entering the index.
Average Fallen Angel Bond Cumulative Return: 6 Months Before to 6 Months After Entering the Index

Source: FactSet. This chart is for illustrative purposes only. Past performance is not indicative of future results. Data is based on bond constituents of the ICE BofA US Fallen Angel High Yield Index that were downgraded to high yield and entered the index in 2004 or later. Index data on and prior to February 28, 2020 reflects that of the ICE BofA US Fallen Angel High Yield Index (H0FA). From February 28, 2020 forward, the index data reflects that of the ICE US Fallen Angel High Yield 10% Constrained Index (H0CF).
2. Contrarian sector approach: The recovery of the energy sector helps demonstrate this. Fallen angels’ overweight to energy has contributed 1.57% to outperformance this year versus the High Yield Broad Market Index and has returned 42.57% since 3/31/2020 (as of 7/31/2020).4
3. Higher relative credit quality: New fallen angels have been rated BB, increasing the index’s BB exposure to 92.78% vs 56.58% in the broad high yield market.5 Accordingly, this year’s outperformance thus far is coming from the BB allocation, which has contributed to more than 100% of its return while other credit quality allocations have detracted performance.
Kraft, Ford and the new energy fallen angels have averaged a 19.36% price return since index entry.6 The average of all 2020 fallen angels is about 12%, which is above the historical average.7 Kraft, EQT and EQM were helped even more as the Federal Reserve (Fed) announced an expansion of the Corporate Credit Facilities on April 9, a few days after they entered the index. Ford has had more support from the Fed, as they bought some of its bonds as part of their program to support liquidity. However, EQT bonds are the top performers (based on price return) since index entry in March 2020 with a 31.20% price appreciation.8

Alpha Potential Despite Tighter Yields
Yields and spreads have tightened significantly from the elevated levels at the end of March. Nevertheless, we believe new fallen angels may provide high yield investors with outperformance versus the broader high yield market due to the significant price returns driven by buying deeply discounted bonds. In our view, a fallen angel high yield strategy performs best in an environment like the current one, characterized by the high volume of fallen angels. Given our outlook for an additional $100 to $150 billion of new fallen angels this year, we do not believe that the current cycle or the potential to outperform has run its course.
DISCLOSURES
1Source: ICE Data Indices
2Source: FactSet, ICE Data Indices, LLC and Morningstar as of July 31, 2020.
3Source: FactSet and VanEck.
4Source: FactSet and ICE Data Indices.
5Source: ICE Data Indices. Data as of July 31, 2020.
6Source: ICE Data Indices. Data as of July 31, 2020.
7Source: ICE Data Indices. Data as of July 31, 2020.
8Source: ICE Data Indices. Data as of July 31, 2020.
A fallen angel bond is a bond that was initially given an investment-grade rating but has since been reduced to junk bond status.
Related: Moat Index De-FAANGed Further


