
Written by: JB Golden | Advisor Asset Management
Slow and steady wins the race, or so says Aesop. After playing the post-COVID investment grade laggard for the majority of 2020, the municipal market’s consistent slow-paced nature has them playing catch up through the first 25 trading days of 2021. While municipals enjoyed a healthy 5.21% year-to-date return for 2020, that was still behind U.S. Treasuries by 279 bps (basis points) as well as U.S. Investment Grade Corporates by a staggering 468 bps. The script has flipped at a welcome time for municipal investors, and against a backdrop of building inflation expectations and broadly higher interest rates, municipals have held their own. The asset class is up 0.77% year-to-date (as of 2/8/21) which is over 220 bps better than the balance of the investment grade fixed income markets. U.S. Treasuries are down 1.50% year-to-date (as of 2/8/21), only slightly better than U.S. Investment Grade Corporates down 1.51% over the same timeframe.
U.S. Investment Grade Corporate & U.S. Municipal Returns
(2/10/2020 – 2/08/2021)
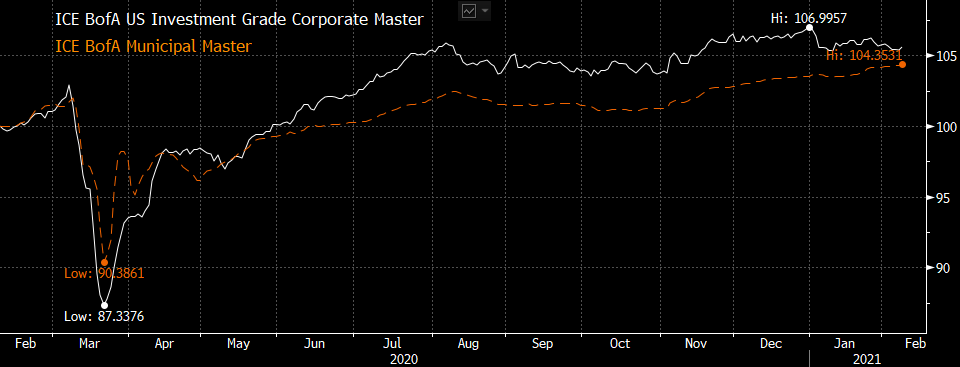
Source: Bloomberg | Past performance is not indicative of future results.
The recent reversion in municipals has been supported by record-setting inflows into the asset class. Lipper reported 1.58 billion of municipal inflows for the week ending 2/5/21 marking 13 straight weeks of inflows and coming on the heels of 2.79b added the previous week. ETFs (exchange-traded funds) are having a “municipal renaissance” as investors clamor to a vehicle not typically associated with municipals. ETFs have added 3.3 billion year-to-date for 2020 – or almost 25% of the 2020 total of 14.3 billion through one calendar month. The Investment Company Institute, which in addition to Lipper tracks fund flows, recently reported over 12 billion of inflows into the asset class, the best start to a year on record. The recent rally is even more impressive when one considers it has come in the face of broadly higher interest rates and a steepening Treasury curve. The 2-year to 30-year U.S. Treasury spread widened by over 30 bps in January, one of the fastest steepening events on record. The U.S. 10-year Treasury was off over 20 bps across the month with the U.S. 30-year Treasury off almost 30 bps. Higher interest rates, a drag on investment grade corporate markets in January, could not derail municipals with AAA municipal benchmark yields effectively unchanged. The recent steeping in the U.S. Treasury yield curve has been notably absent in municipals as demand from yield-hungry investors continues to keep longer dated yields muted.
U.S. Treasury & U.S. Municipal Yield Curve
(as of 2/8/2021)
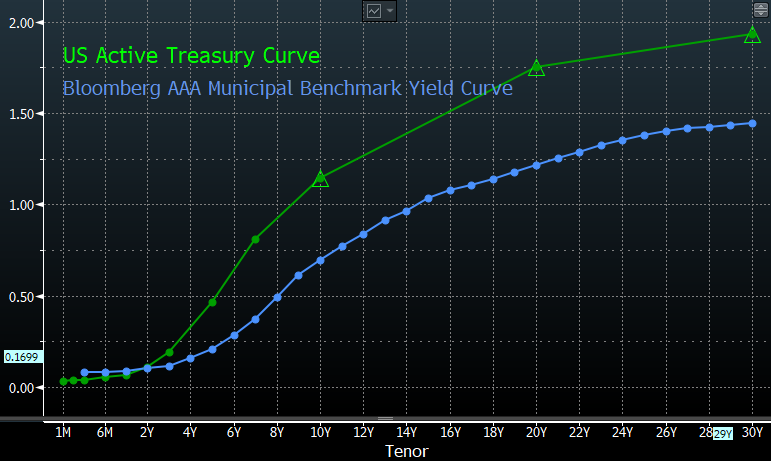
Source: Bloomberg | Past performance is not indicative of future results.
Furthermore, the recent relative outperformance of municipals versus Treasuries has pushed relative valuation measures into territory that could aptly be called “rich” by just about any measure. AAA benchmark yields sit at or near all-time lows and the Bloomberg 10-year Municipal-to-Treasury ratio currently sits just north of 60% with the 30-year Municipal-to-Treasury just shy of 75%, both of which are the lowest ratios on record since Bloomberg began collecting data in 2001.
10-Year & 30-Year Municipal-to-Treasury Ratio
(as of 2/8/2021)
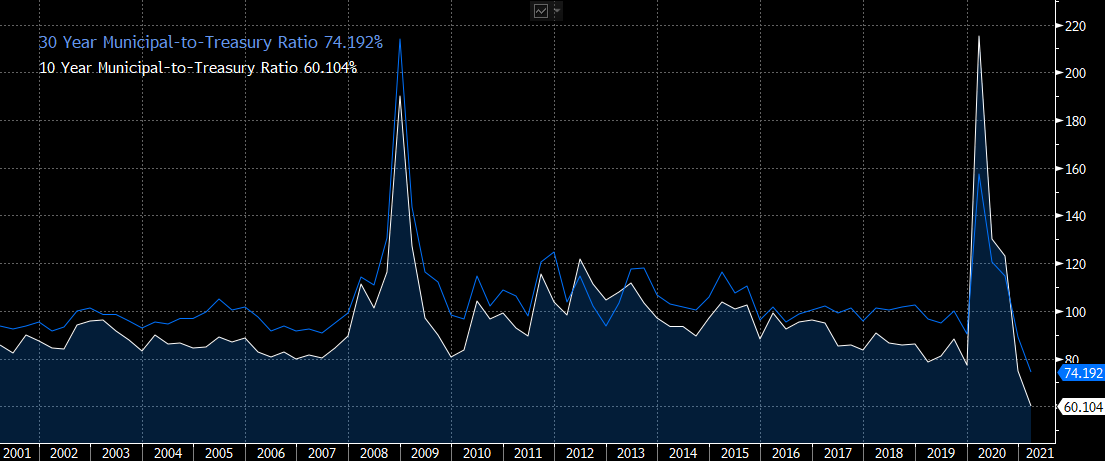
Source: Bloomberg | Past performance is not indicative of future results.
So, what is driving record inflows in the face of higher rates, record low benchmark municipal yields and record high valuations? It would be easy to chalk it all up to record-low supply. There is no doubt that constrained supply plays a role and puts the asset class in a unique position. Municipals are insulated to some extent from broader rate volatility, especially as is the case recently, when net new issuance of tax-exempt bonds is negative on a year-over-year basis and does not even cover the reinvestment need of current investors in the asset class. Couple that with the growth in taxable municipal issuance to service a yield-starved international crowd that is saddled with almost 16 trillion in negative-yielding sovereign debt, and you have even greater downward pressure on traditional tax-exempt new issuance. This dynamic is likely to remain a fixture of the tax-exempt markets for the foreseeable future and we believe this certainly makes the asset class attractive. With that being said, constrained supply does not tell the whole story. The reality is even at record-setting valuations the asset class looks cheap relative to available options, especially when considering the market’s current deference to short duration. Municipals have the potential to satisfy a need for low default, high quality, income-producing assets that is difficult, if not impossible to replicate for U.S. investors in any other fixed income asset class currently available.
First and foremost, outside of U.S. Treasuries, there is no other fixed income asset class that carries the default profile or credit quality found in U.S. municipal markets. Investment grade corporates would be the closest comparison outside of Treasuries but the difference in long-term default rates is meaningful. U.S. Investment Grade Corporates carry a long-term historical default rate near 5% relative to U.S. tax-exempt Municipals, which carry a fraction of the default risk at less than 0.75%. While areas of the corporate market provide the potential for higher returns, they come with significantly higher exposure to lower grade credit risk than Municipals. As rated by S&P, approximately 53.24% of the investment-grade corporate market currently resides in BBB territory, contrasted with 7.47% in Municipals. Almost two-thirds of the municipal market resides in credits of AA or better. For investors astute enough to make an apples-to-apples comparison on credit quality Municipals are all the more attractive, especially on the front end of the yield curve.
U.S. Investment Grade Corporate A-Rated Curve & U.S. Municipal A-Rated Revenue Curve
(as of 2/8/2021)
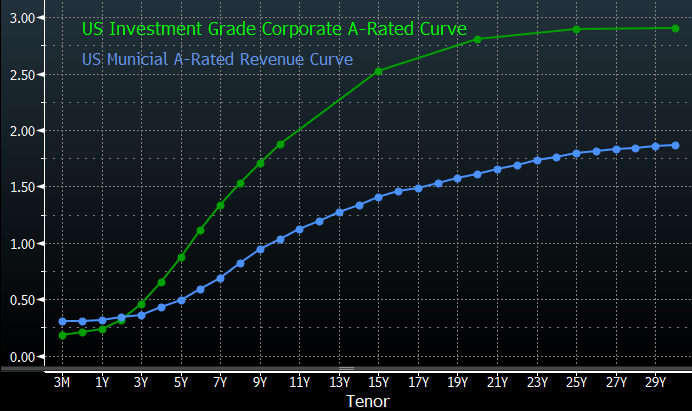
Source: Bloomberg | Past performance is not indicative of future results.
A-rated Municipal revenue bonds are currently offering higher yields than short-term corporates of comparable credit quality on an absolute basis, much less after accounting for the tax efficiencies. This relationship holds out to three or four years as it does for any A or better credit quality. On a taxable equivalent basis, Municipals outpace corporates out to the five to seven-year area of the yield curve. In an environment with interest rates moving higher, short duration exposure is even more in vogue. Given the yield disparity it should not be a surprise that investors are piling into Municipal debt. With both a yield advantage out to intermediate maturities and a credit quality advantage across the curve, we think corporates are not necessarily a viable alternative for many municipal investors where high quality and capital preservation are of paramount concern.
On the flip side, while U.S. Treasuries check the box when it comes to credit quality they fail miserably when considering income and duration. While interest rates have moved higher, they still a leave a lot to be desired for the income investor. 10-year Treasury rates don’t even outpace current, modest levels of inflation, much less offer investors any real return. Furthermore, interest rate risk in the Treasury market can be acute. Take for example the current 10-year Treasury trading at a slight discount to par to yield 1.12%. The move up in yield (22 bps) on the month created a loss on the order of 1.50% which is well over a year’s worth of income. The Bloomberg Barclays Municipal Bond Index currently carries a 0.91% tax-exempt yield-to-worst (taxable equivalent approximately 1.40%) with an option-adjusted duration of 5.1 years. When compared to the Bloomberg Barclays U.S. Treasury Index with an approximate yield of 0.98% (tax exempt equivalent of approximately 0.64%) and a duration of seven years, it makes sense investors are opting for comparable returns with approximately 70% of the duration risk. Given the lack of available alternatives to Municipal bonds, it should come as no surprise that we are seeing record demand in the face of record valuations. Given the supply constraints, along with the yield and credit quality advantages currently available, we believe it is reasonable to expect that Municipals will continue to be a go-to asset class for investors looking for capital preservation and income for the foreseeable future.
Related: Why Financial Advisors Should Watch the Bond Market