There’s a lot going on in the world right now and I’m thankful I don’t need to pretend to be a war general or an Eastern European expert to complete my analysis of the financial markets. Instead, I focus on the data derived from the market and attempt to be as unemotional in its review as possible. In my latest letter for Thrasher Analytics I describe the current market as trying to fly a kite during a hurricane. Sure it will fly for a few seconds until the wind abruptly changes direction and sends the kite back to earth. One of those gusts of wind right now is coming from the fixed income market.
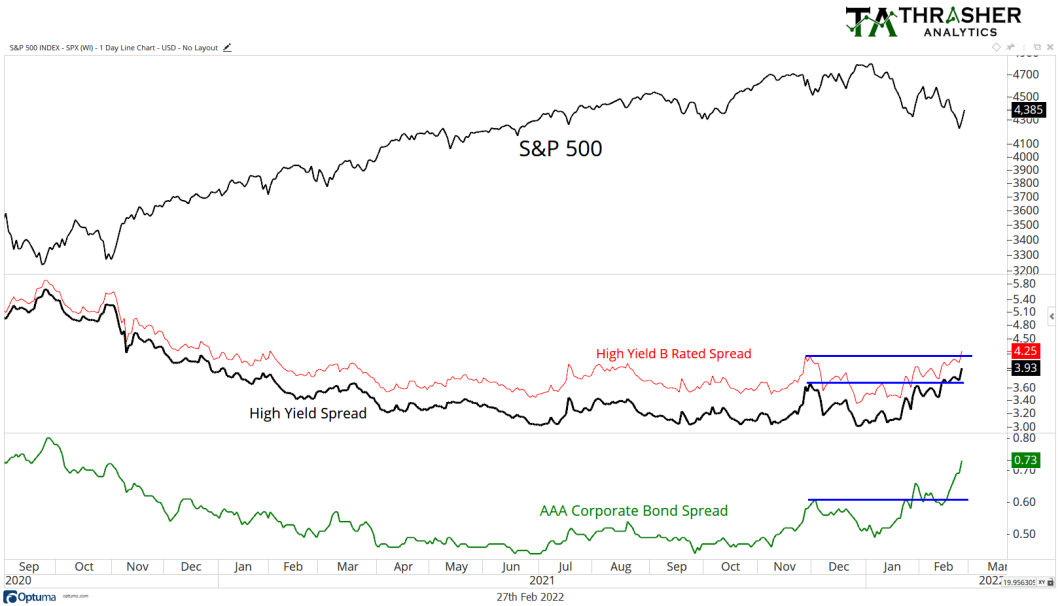
When equity markets begin to correct one of the first places I turn is to bond spreads. Because if bond traders aren’t scared, then the fear showing up in equities is often short-lived. But if bond traders are panicking, then there’s the potential for a more severe and longer-term down trend to show up in equities. In January, when we started seeing stocks weaken, High Yield spreads were still at historically low levels and hadn’t begun to show much concern. That’s unfortunately changed.
As equities continued to move lower into February, both the High Yield Spread (black line) and AAA spread (green line) began to make higher-highs, breaching the prior December peaks. Since then, they have continued to widen as bond traders demand a higher interest payment relative to Treasury’s in order to own the debt.

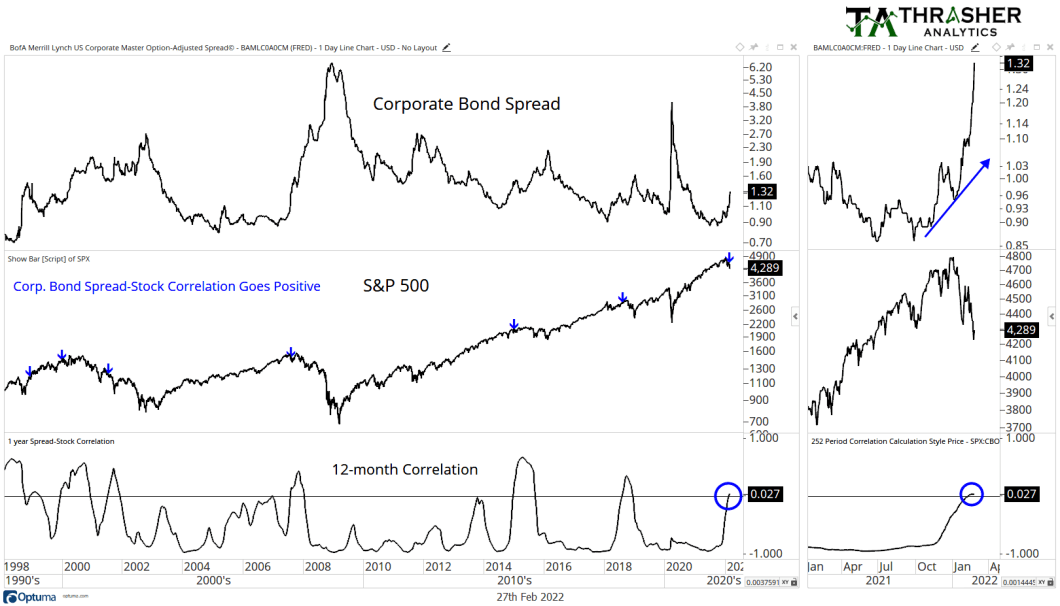
Let’s take a look at a longer-term view of the bond spread and equity trends. Historically, these two have a negative correlation. As equities go higher, spreads narrow which confirms the bullishness in equities as fixed income have less concern about the bonds relative to Treasury’s. That relationship has now shifted. The 12-month correlation between the BAML Master Option-Adjusted Spread and the S&P 500 has gone positive. As you can see from the blue arrows on the chart below, this hasn’t happened very often. The last three times the spread-equity correlation went positive was during the 4th quarter of ’18, 2014, and 2007.

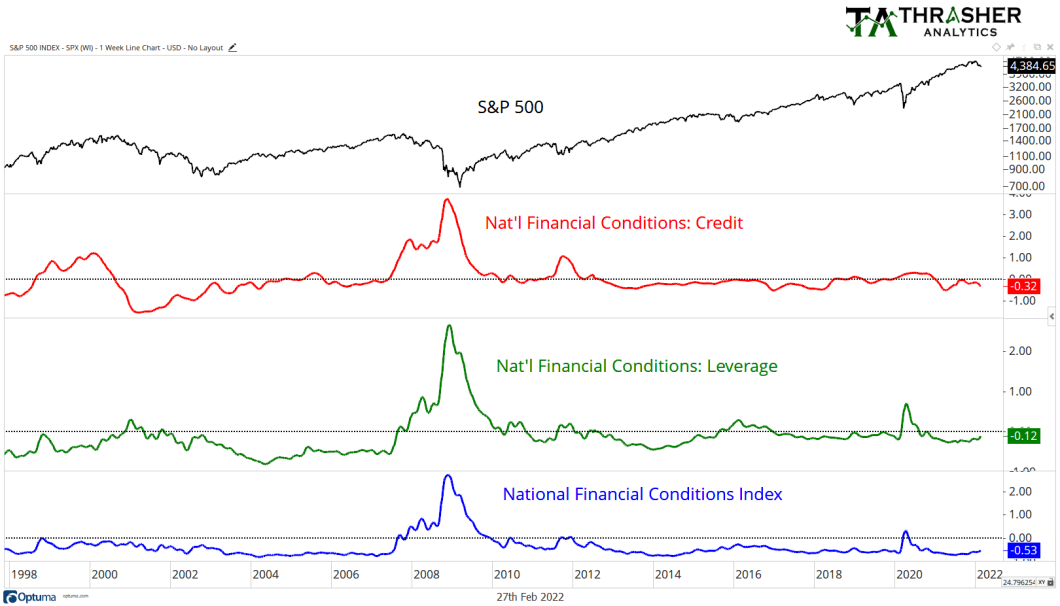
From here, I’ll be keeping a close eye on the National Financial Conditions Index, a set of data from the Chicago Fed. I’m specifically interested in the Credit and Leverage sub indices. Here’s how the Chicago Fed describes them:
“The nonfinancial leverage subindex of the NFCI best exemplifies how leverage can serve as an early warning signal for financial stress and its potential impact on economic growth. The positive weight assigned to both the household and nonfinancial business leverage measures in this NFCI subindex make it characteristic of the feedback process between the financial and nonfinancial sectors of the economy often referred to as the “financial accelerator.” Increasingly tighter financial conditions are associated with rising risk premiums and declining asset values. The net worth of households and nonfinancial firms is, thus, reduced at the same time that credit tightens. This leads to a period of deleveraging (i.e., debt reduction) across the financial and nonfinancial sectors of the economy and ultimately to lower economic activity.”

As of right now, the NFCI and the Credit and Leverage components remain below zero, which is a good thing. But should they begin to rise, which the Leverage index has begun to slowly do, then the underlying issues being shown by the expanding credit spreads may get confirmed as a bigger deal. Stocks haven’t had a strong start to 2022, at one point last week over 35% of large cap equities were down over 20% and over 10% are off their highs by over 30%.
Fixed income markets are beginning to show some trepidation. Hopefully these conditions don’t persist, I’ll definitely be keeping a close eye on how these spreads change in the coming weeks.
Related: Bond Bull Market Coming? Take The Road Less Traveled


