Written by: Rafael Zorabedian, Contributor
Given this week's headlines with Bitcoin plunging, did you take a peek at interest rates? Could a stronger dollar lie ahead with higher rates?
While everybody’s eyes are peeled on cryptocurrencies and a crowded short DXY trade, let’s revisit the potentially polar opposite of a crypto instrument: 10-year notes. Yields rose on Wednesday, settling at 1.683%, just off the intraday high of 1.692%. I like to take a look when few others are looking. As yields closed near the highs of the day, with other risk assets seeming out of favor, at least temporarily, let’s revisit the 10-year notes.
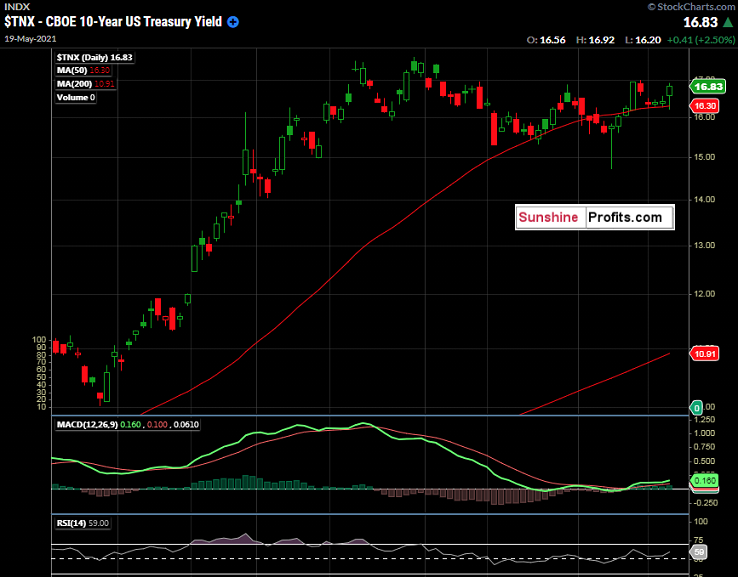
Figure 1 -CBOE 10-year US Treasury Yield Daily Candles January 19, 2021 - May 19, 2021. Source stockcharts.com
Bonds and equities have an interesting relationship. The trade that has worked in recent years has been long the bonds or 10-year notes (short yield) and long the $SPX . That trade has worked for a long, long time, overall. However, trends eventually change and given the current environment of the US Dollar Index approaching a key long-term Fibonacci retracement level, and yields looking like they want to climb, things could turn out differently in the short run.
In my May 11th publication , we were eyeing potential precision entry levels for a short trade in the June 10-year notes (higher yields). Remember, bond prices and yields move inversely to one another . We discussed some key technical indicators, and the idea was sound. Reviewing this analysis, the 50-day moving average was a key level that was analyzed and discussed. That idea was put on pause due to the bounceback that occurred in the $SPX , and a trader would usually not want to be caught short bonds with a snapback rally and $VIX crush in the cards. Since that is so “last week”, we can now take a look and see what has transpired since then. The 50-day moving average has held like a rock in $TNX over 4 trading sessions. We can see what appears to be a “cup and handle(y) type of bullish continuation pattern that is forming here. It just feels like rates want to rise, and therefore the 10-year note futures could fall.
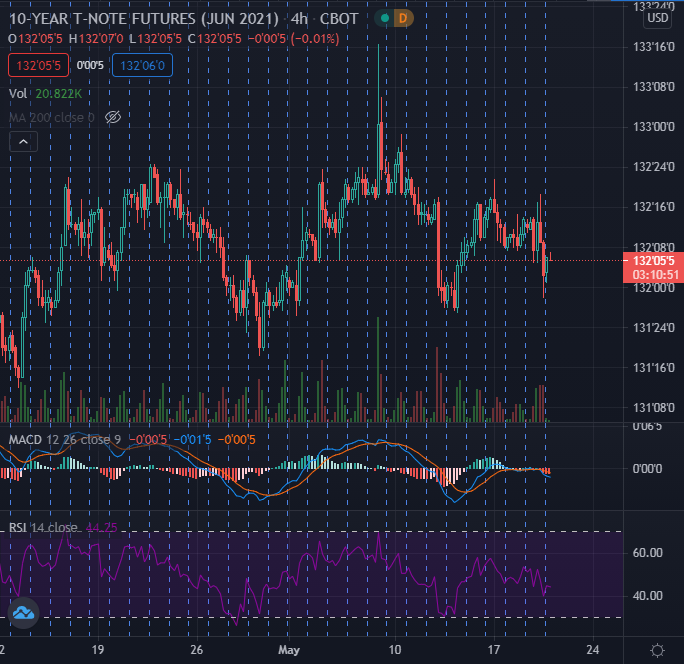
Figure 2 -June 10-year T-Note Futures CBOT (ZNM2021) 4 Hour Candles April 12, 2021 - May 19, 2021. Source tradingview.com
It really doesn’t get more textbook than this , as we can see a clear head and shoulders formation occurring here in the June 10-year notes. Rallies to the neckline have stalled, and yields have been finding support at the 50-day MA. Notice the potentially bearish MACD (12,26,9) action on the 4-hour candle chart, trading just south of the zero line. RSI(14) appears to be anything but bullish.
But, what do you think? The Fed says rates will remain “lower for longer”. That theme still exists. However, please remember that the Fed only sets the overnight lending rate and not the longer-term duration rates. Thankfully, free markets determine such rates. What is the market telling us? And what about the DXY? As we approach some longer-term important technical levels, how could this affect the price of 10-year notes? There is a flux of data pulling markets in bipolar directions at this time, in my opinion, and this could create opportunity.
Based on the recent price action, there could be a potential opportunity to benefit from a market curve pricing discrepancy between the actual short-term rate levels set by the Fed, and what the charts are showing us with the recent action in the 10-year note.
Related: How Advisors Can Stack the Investment-Grade Bond Deck in Clients' Favor