
Trending

Written by: Sandra Testani, CFA, CAIA | American Century
The final months of 2023 brought a last-minute market rally for stocks and bonds influenced by decreased inflation and the Federal Reserve’s (Fed's) less aggressive stance. The Fed’s decision to keep interest rates unchanged helped to ease concerns about a potential recession and led to expectations of an economic soft landing and eventual Fed pivot.
ETFs Outpace Mutual Funds as Flows Leader
Although it may have been overshadowed by the fourth-quarter rally, perhaps the biggest surprise in 2023 was the meteoric rise of active exchange-traded fund (ETF) strategies. While active ETFs account for only 6% of the overall market share, they captured 21% of the total net flow as of year-end—$117 billion in absolute terms. That’s a new all-time high for active ETFs that signifies favorable growth potential in the future.
In net asset terms, active ETFs have grown from $112 billion in 2019 to $509 billion in 2023—a 35% five-year compound annual growth rate.
ETFs have experienced strong and steady inflows over the decade.
Figure 1 shows 2021 established a highwater mark at over $900 billion. In contrast, mutual funds have posted outflows for four of the past six years, including over $900 billion in 2022.
While mutual funds still represent the larger pool of assets today, net flows in recent years have significantly favored ETFs.
Figure 1 | Flows Have Favored ETFs in Recent Years
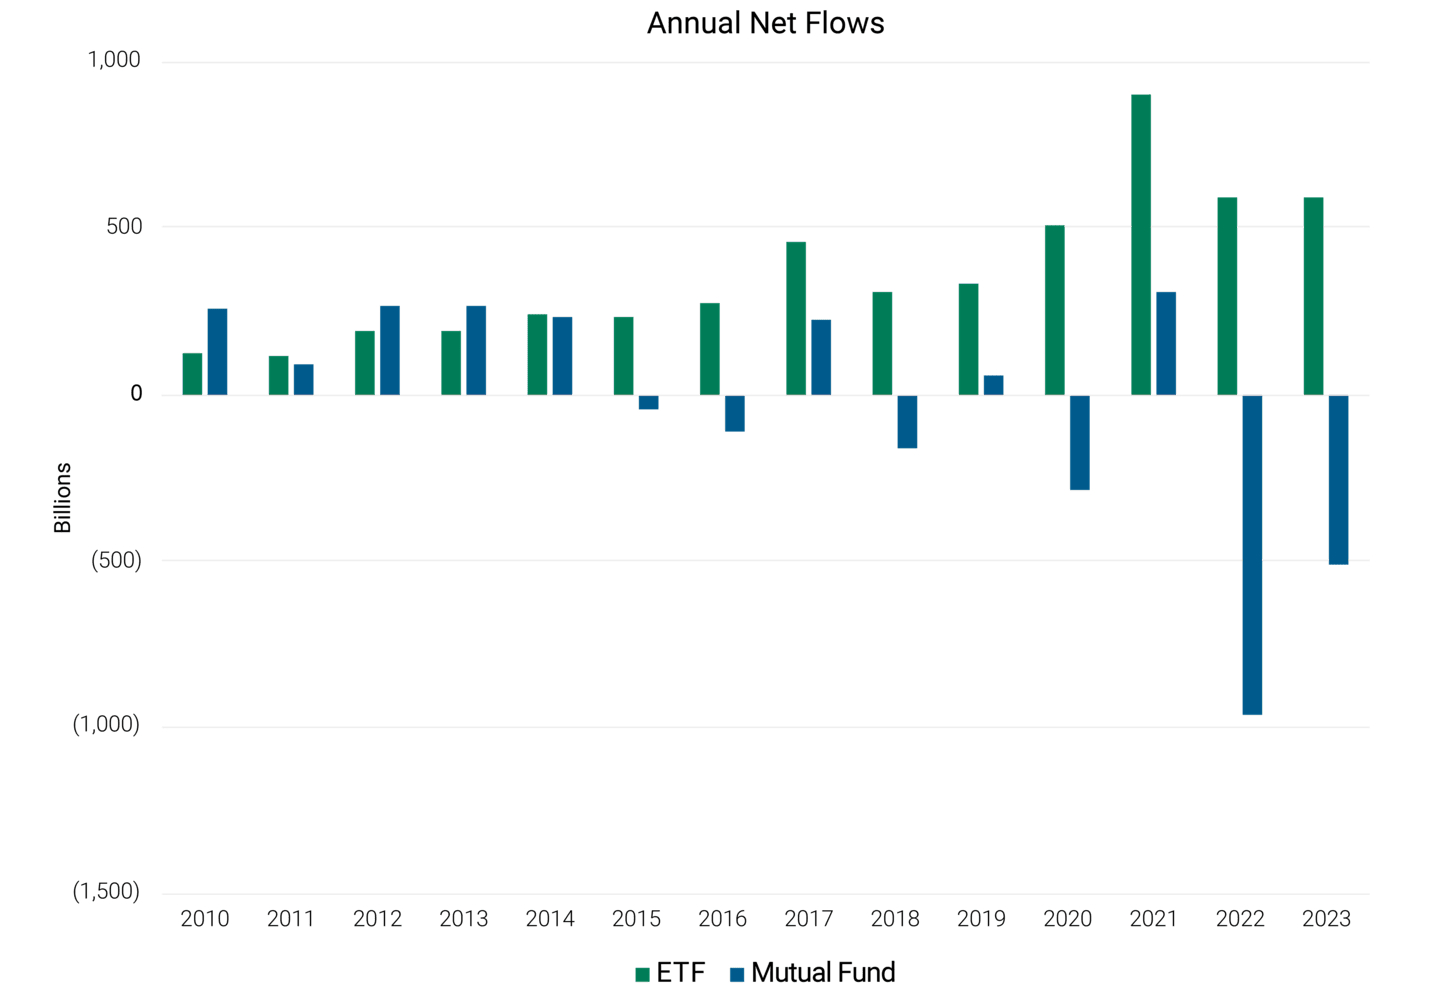
Data as of 12/31/2023. Source: Morningstar Direct Asset Flows Module (excludes Fund of Funds).
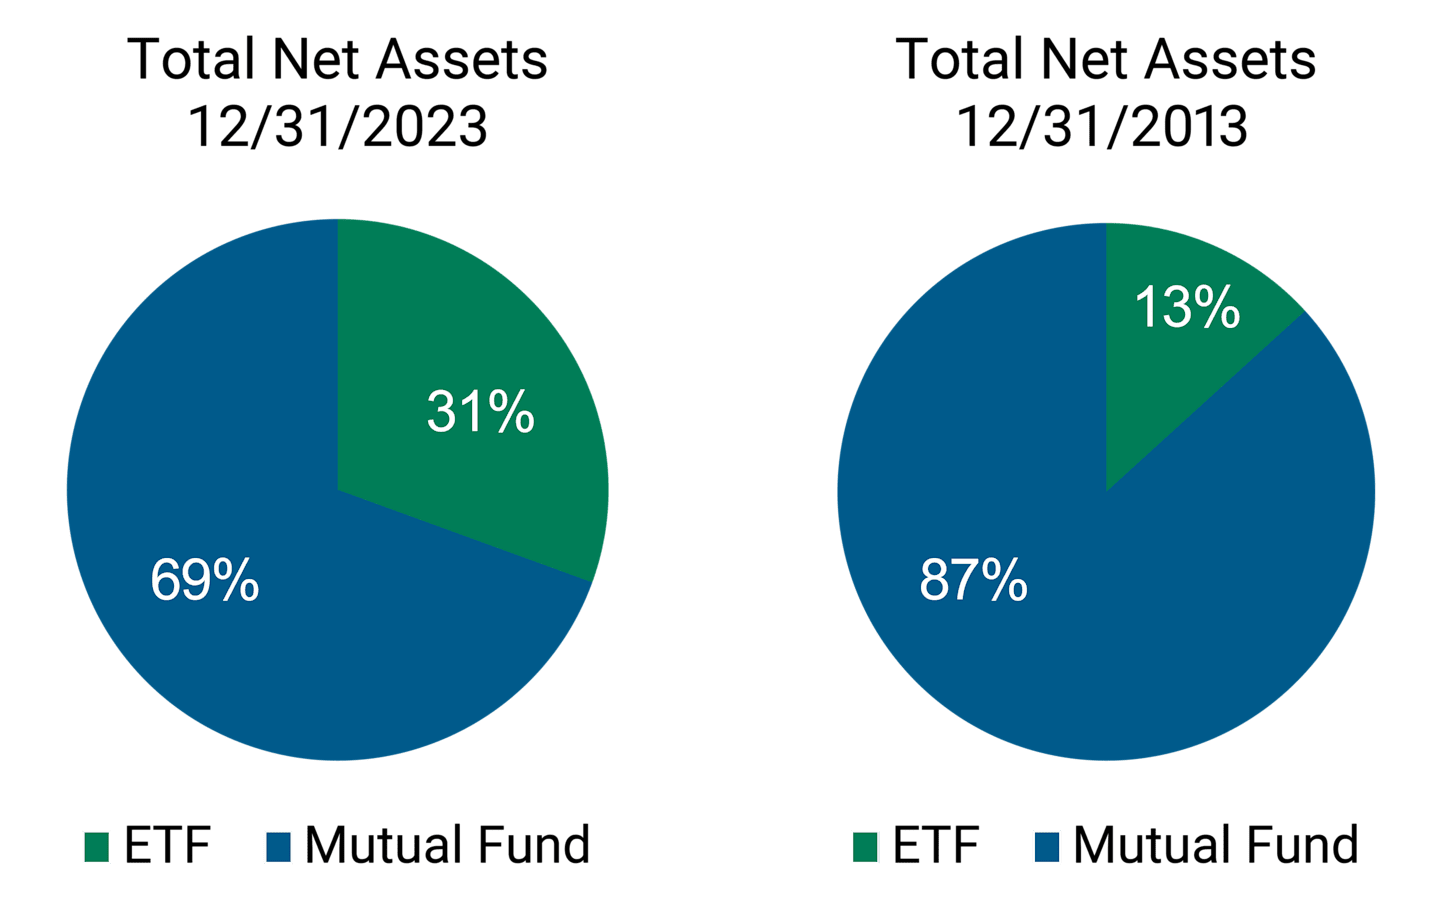
Data as of 12/31/2023. Source: Morningstar Direct Asset Flows Module (excludes Fund of Funds).
-
69% of overall assets under management are in mutual funds (more than $18 trillion), down from 77% in 2022.
-
ETFs now represent 31% of all assets under management, up from 23% in 2022 and a change from only 13% of assets just 10 years ago.
Bright Future for Active ETFs
We believe the breadth of success of active ETFs points to a bright future. Looking at net flows, both active equities (more than $54 billion) and bond ETFs (more than $15 billion) shattered previous records. Active ETFs even outpaced the broader peer group that included alternative and nontraditional equity categories—Active ETFs finished with a $33 billion gain in assets versus just $3 billion going to passive ETFs.
Product design was integral in active ETFs to reach such milestones. Active strategies in the ETF wrapper leveled the playing field with mutual funds by offering lower fees and the probability of lower capital gains while still offering alpha potential.
Of the 525 new ETFs in 2023, 74% were active strategies, showing that the momentum for innovation is behind the active wrapper.
Market Fuels ETF’s 2023 Surge
U.S. Treasury yields, which had soared to multiyear highs in October and dragged year-to-date returns for most fixed-income sectors into the red, staged a rapid and steep reversal in the year’s final two months. Plunging yields further supported optimism among stock investors.
As measured by the S&P 500 Index, U.S. stocks posted respectable returns of 10.7% from January through October. Cumulative returns in the final two months of 14.1% brought the year-to-date result above 26%, nearly twice the annual average over the last 10 years.1 The tech-heavy and AI-sensitive Nasdaq 100 Index2 boasted returns of 55.1% for the year3.
These returns made it tough for investors to stay on the sidelines and the dam finally burst with record-breaking cash pouring into the ETF industry.
Fourth-Quarter ETF Cash Flow Breakdown:
-
November, $98 billion, showing glimpses of what may come.
-
December, $128 billion, shattering the monthly record.
-
Fourth quarter, $581 billion, bringing the cumulative total to the third highest in ETF history,
-
$351 billion to equity ETFs
-
$204 billion to fixed-income ETFs (comfortably beating their five-year flow average of $174 billion)
-
$39 billion combined to alternatives and nontraditional equities, showcasing the wide breadth of investment opportunities in the ETF wrapper.
-
$10 billion loss to commodities—for the third year in a row, the only primary asset class in outflows; 2023 marked the steepest decline in recent years for commodities.
-
A Closer Look at Equity ETFs in 2023
It is not how you start but how you finish is a perfect way to describe equities last year. Until November, the sentiment towards equity ETFs was relatively meek, averaging less than $20 billion of net inflow in a month. However, the last two blockbuster months single-handedly doubled the new cash flow, $180 billion.
-
U.S.-centric funds were far and above the leader, gaining $283.88 billion for the year—over $252 billion alone going into large-caps. That is more than triple international equities reaching $81 billion. Over $252 billion alone went to large-cap ETFs, and small/mid-caps recorded a respectable $46 billion mostly through small-cap strategies.
-
A rising tide in the last quarter did not lift all sector-specific ETFs out of the negative territory. These steep outflows were partly offset by sectors most sensitive to interest rates such as technology. Communications and cyclicals saw positive flows, but were more than offset by declines in energy, health, and consumer defense which combined lost $23 billion.
-
Factor ETFs were another weakness for equities, only attracting $42.39 billion in 2023 compared to the $144 billion draw in 2022. The decline can be attributed to a couple of things: 1) significantly weaker demand for dividend funds, 2) risk-on sentiment fueling outflows in low-volatility products, and 3) investors trimming their exposure to traditional value strategies.
-
Quality-oriented ETFs were a bright spot, attracting $25 billion in net flow, despite an overall risk-on sentiment. This represents an increase of 57% based on the organic flow rate in 2023. Growth came in second place with $20 billion.
A Look at Bond ETFs’ Comeback in 2023
Given the recent volatility, not many could have predicted that bond ETFs flows would have their third-best year last year. The $203 billion net flow was just shy of the $211 billion record established in 2020. In context, bond ETFs accounted for roughly 19% of the market share, but they absorbed 35% of the net flow.
-
The new interest rate regime attracted a wider swath of investors who availed themselves of ETFs’ flexibility to express tactical views.
-
As short-term rates hit recent record levels, investors shifted towards ultrashort funds ($+36 billion) and away from short-term bonds ($9 billion outflow).
-
Intermediate bonds attracted $85 billion in net flow. The intermediate core category doubled cash flow compared to 2022, and intermediate core-plus nearly tripled, posting the highest organic flow rate of 44% among this duration cohort.
-
Long-term bonds were a perfect proxy for investors trying to front-run the Fed’s future rate cuts as they reeled in $50 billion.
-
The risk-on-year-end rally carried over to fixed income. High-yield ETFs pulled a sharp U-turn, going from hefty outflows to a $5 billion surplus at the end of the year.
-
Corporates also had a very good end to the year, with the $12 billion in net flows; a notable improvement from 2022.
-
Some of the other main contributors to the fixed-income ETF growth: municipals’ gained $15 billion; global and emerging markets bonds’ added $11 billion; and target-maturity funds added $12 billion.
A Look Ahead: ETFs Rewriting Record Books?
Predicting where 2024 will take us without a crystal ball is impossible, but we can make some assumptions. The continuation of outflows from mutual funds going to ETFs and future conversions appears likely to continue to boost ETF market share. Furthermore, the possibility of an active ETF share class on the horizon can further support asset managers' transition to the ETF business.
Additionally, active ETF assets under management have set records each year since 2008, which bodes well for the overall future growth of the industry. Active ETF product development has continued to outpace passive ETFs and active mutual funds, offering investors more choice, with the potential for tax-efficiency and attractive costs. We believe the benefits of the structure and innovation within it should attract more investors looking for new building blocks in their portfolio construction.
Asset and flow data as reported by Morningstar Direct as of 12/31/2023.
American Century Investments is the fourth-largest active ETF issuer and now #15 on the overall ETF issuers list.
Source: FactSet as of January 31, 2024.
Related: Making Higher-Income People Pay for Social Security Shortfalls