ROAR Score weekly update
-
Our "Reward Opportunity and Risk" (ROAR) score drops to 10 from 30. On Wednesday morning, I'll adjust my personal 2-ETF portfolio to reflect that.
-
This means the allocation for a simple 2-ETF portfolio that can only be allocated to SPY and BIL would be 10% SPY and 90% BIL.
-
This is what I mean by "avoid big loss." Even if this latest dip doesn't get much worse, I made it this far in the investment business (39 years) by never trying to be a hero.
3 Quick Thoughts on markets
-
The ROAR Score is a simple concept, and it has been very effective for me. However, it only scratches the surface when it comes to how investors can use periods of volatility to their advantage.
-
I think this is MUCH better than sitting there and hoping the market goes back up. The stock market is an inanimate object that doesn't care about us or who we are. Treat it as such.
-
Weeks like the one we've had so far are when I've done my best work over the years, losing a lot less or increasing my portfolio value. This is what Sungarden is all about. Because while investments can always go up, as noted here many times, risk is as high as I've seen it.
3 ETF (or index) charts I’m watching
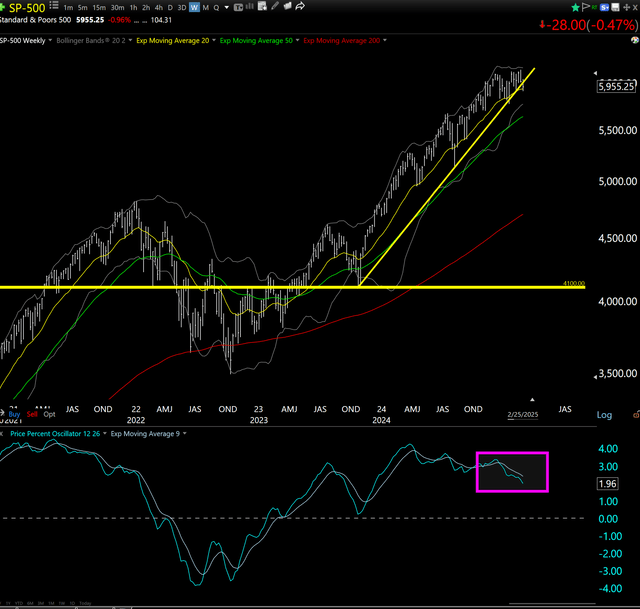
This says 2 things to me: first, that the S&P 500 has had a historic run higher. And, it is now more vulnerable to reversing that than at any point since this 50% rally started in late October of 2023. That's because the yellow trend line is broken. A rapid reversal before this week ends would level that out a bit. But not change my view that this market is priced for perfection.
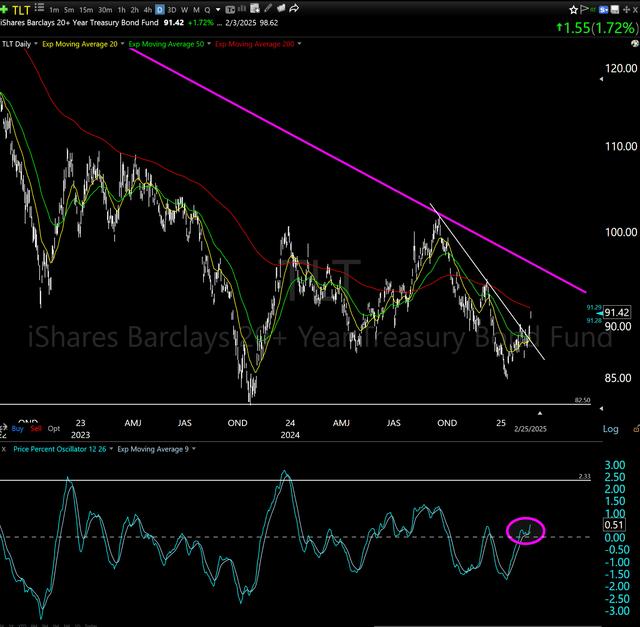
It sure doesn't help that the long U.S. Treasury market is doing this! That looks like a breakout in price/lower in yield (purple circle at bottom). If it stops around TLT = $95, false alarm. If not, the Trump Administration and many home owners will be very happy. They can both refinance (U.S. Government debt and mortgages) at lower rates. But what helps bonds might hurt stocks.
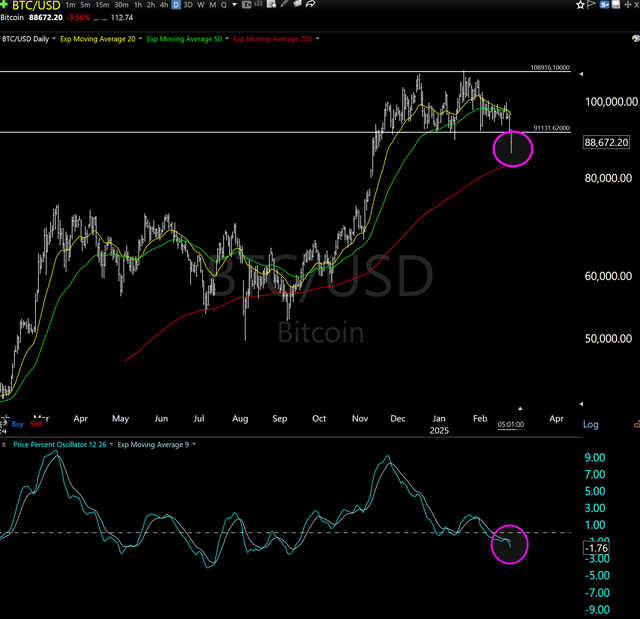
Bitcoin: I'm no expert in this for sure. And it has been tough to chart compared to stocks and ETFs. But if I looked at this without knowing what it was, I'd be looking lower. Much lower.
3 stock charts I’m watching
This week, instead of looking at 3 stocks I simply track, I'll show 3 recent examples of stock I bought as part of Sungarden YARP Portfolio, the investing group I lead at Seeking Alpha, where subscribers follow along with my own trades as I make them.
Importantly, I don't buy any stock these days without a "dog collar," which is my "pet" name for owning a stock, buying a put option to limit downside risk and selling a covered call to help reduce the cost of that protection. So these are 3 of the stocks I own. The specific option positions related to them are a subscriber benefit.
While the vast majority of stocks I scout look simply awful on a forward-looking basis, KO is one of those "high class problems." It rallied after I bought and "dog collared" it, but the move was so quick, now I'm in danger of the stock hitting its call strike price. That makes it "dead money" unless I do something like buy more stock or buy call options, to retain the ability to profit further. This is so typical of what markets do now. It is feast or famine. That used to be an earnings season thing, but now it happens any time.

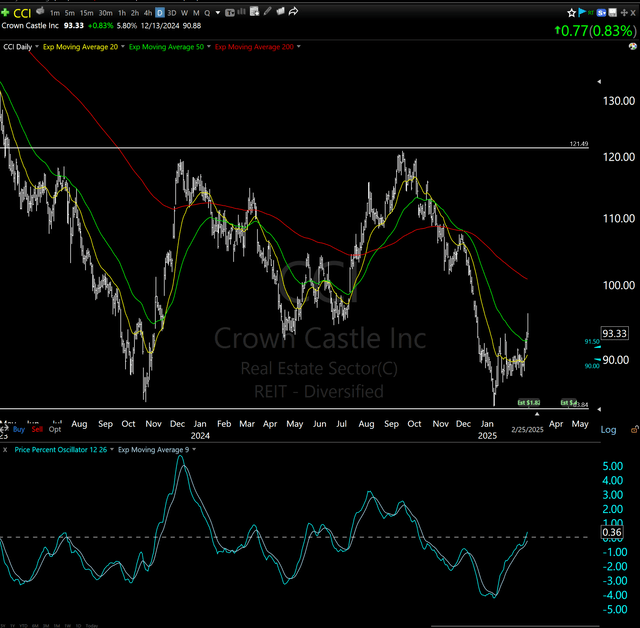
This cell tower builder, a REIT, definitely fits the "dog" description. While it has paid a nice dividend over the past several years, It was down from $130 (to $90 the past 2 years, as shown on the chart. But (not shown) if we go back further, CCI ended 2021 at $209 a share. So a tidy 55% "dip" there on a price basis. So, a classic dog collar situation. I would not care to own it on its own, but the collar strategy allows me to sleep at night...and avoid the dog house.
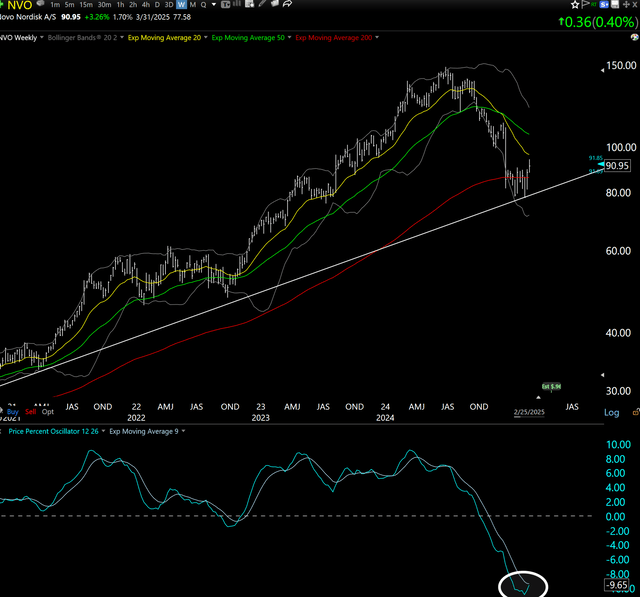
Novartis was a darling of the pandemic era. But investors sold the stock off hard in 2024. This is a much higher quality company than CCI in my view. But they both make for good dog collars, since this market is driven so much more by technicals now than fundamentals. And this just had a nice-looking bounce on this weekly chart. I like this one as comeback story...but only with that option collar attached.
Final thoughts for now
I showed the S&P 500 chart above, but the real potential market trouble is more focused in the Nasdaq 100 (QQQ). But the S&P 500 is so driven by the Nasdaq, thanks to flying Mag-7 stocks leading it, that sets it up to be vulnerable by association. And small caps look at least as bad.
This market has escaped from this type of trouble many, many times. We'll see if Houdini has another one here. My approach is not about predicting the future. It is about evaluating the market's "story" from all sides, and choosing and adjusting my exposure as that story evolves.
Related: Markets in Motion: Why the Same Forces Still Drive Trends