ROAR Score weekly update
-
Our "Reward Opportunity and Risk" (ROAR) score remains at 20 for the second straight week.
-
This means a 2-ETF portfolio that can only be allocated to SPY and BIL would be % SPY and % BIL.
-
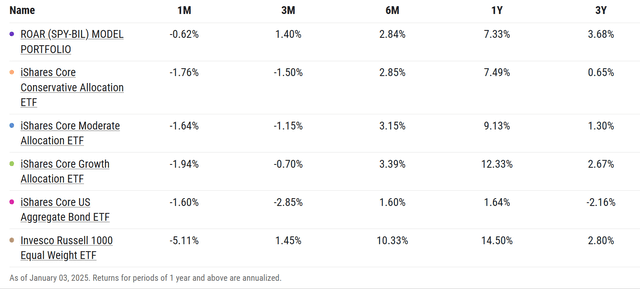
Here's a quick snapshot of the ROAR (SPY-BIL) 2-ETF portfolio, now that it has passed the 3-year mark. This table just goes to show how misunderstood the current market environment is. Look at that far-right column, the 3-year total returns. Sure the S&P 500 is up about 9% a year, thanks to 2 great years following 2022's disaster. But the simple, 2-ETF ROAR portfolio, tactically allocating to only SPY and BIL, outperformed all 3 traditional "allocation" portfolios, the AGG bond index and even the top 1000 stocks (listed last).
3 Quick Thoughts on markets
-
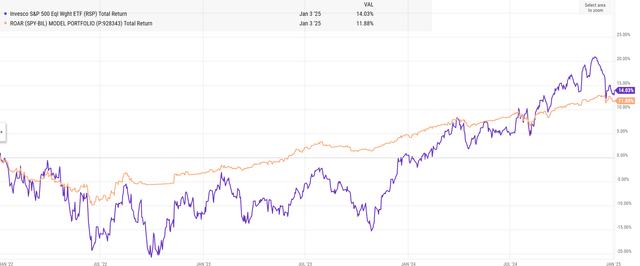
I'll cover my updated market views in the 6 charts below. Its been a quiet holiday season for the most part, and I want to devote just a bit more of this issue to what I've observed by watching and managing the 2-ETF ROAR (SPY-BIL) portfolio for 3 years now. This time, a line graph comparing its ride to that of RSP, an ETF that tracks the equal weighted S&P 500 index.
-
Neck and neck after 3 years? Yes. And the ROAR portfolio was ahead of RSP nearly the entire time. This is NOT about "past performance," but about RISK MANAGEMENT in the investment process. That's what I set out to do 3 years ago when I started running this 2-ETF portfolio with my own money. I truly believe that many investors try to make this too complicated. And while I am a huge fan of tactical management, using options directly and ETFs that deploy them, single stocks and plenty of other less mundane tactics to manage money, there's something to be said for most investors in regards to the KISS method (keep it simple, silly!)
Some additional stats of note: the ROAR portfolio's standard deviation was 4.6%, which is akin to about a 5-year US Treasury Note. And its Alpha above its formal "benchmark" (AOK: the 30/70 stock/bond mix, or "Conservative Allocation" ETF) is a strong 2.3%. That's another way of saying that if AOK was flat, the ROAR portfolio is expected to still earn 2.3%.
-
In addition to the Sungarden YARP Portfolio service at Seeking Alpha, we are always looking for more ways to meet investors where they are. Most recently, by expanding this original 2-ETF portfolio to a set of 4, to target different types of reward/risk tradeoff. If you want to learn more about that, just let us know. We are, at the end of the day, a research firm, with the goal of expanding investor minds about the realities of modern markets. And how to take advantage of them, without descending into speculation or getting too "lazy" with buy-and-hold-forever strategies that are great for Wall Street fee collectors, but not always for the end investor. None of the above may excite a Bitcoin, Tesla or Nvidia investor, but I think it speaks volumes about the ability of tactical investing and risk management to weather future storms.
3 ETF (or index) charts I’m watching
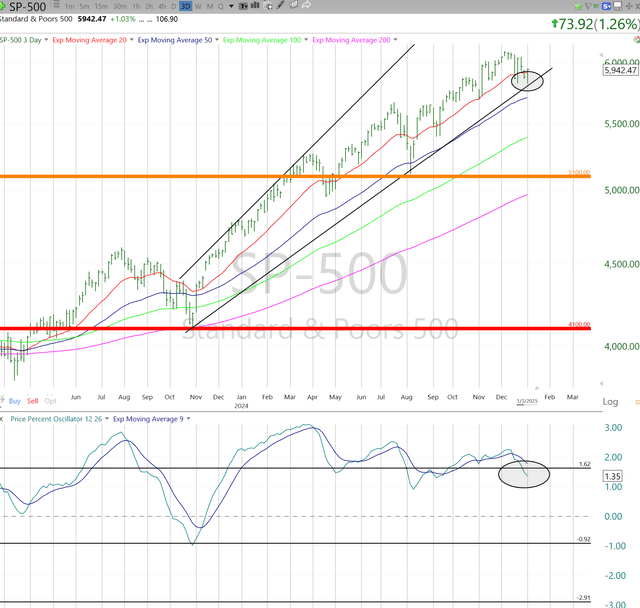
There's a lot less to say today than when we get a month or so into 2025. But here is THE chart I'm looking at to start the year, when it comes to the broad stock market. The S&P 500 is right on its 13-month trend, and looks more likely than not to break down. However, if it survives yet another one of these "close calls" technically, that will be very significant.
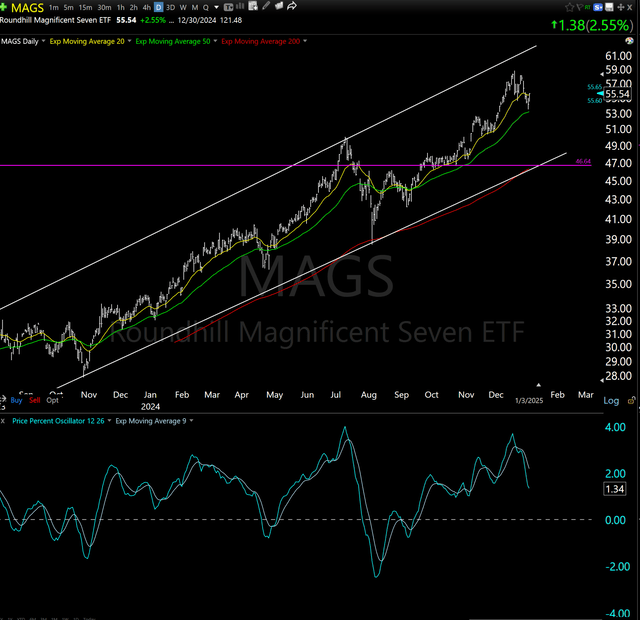
And this is really the driver of the S&P 500. The Magnificent 7 stocks. They are nearly 40% of the index now. Healthy? Not at all! But sustainable for a while longer? I'm not expecting it but there's no way we can rule it out. Balance...
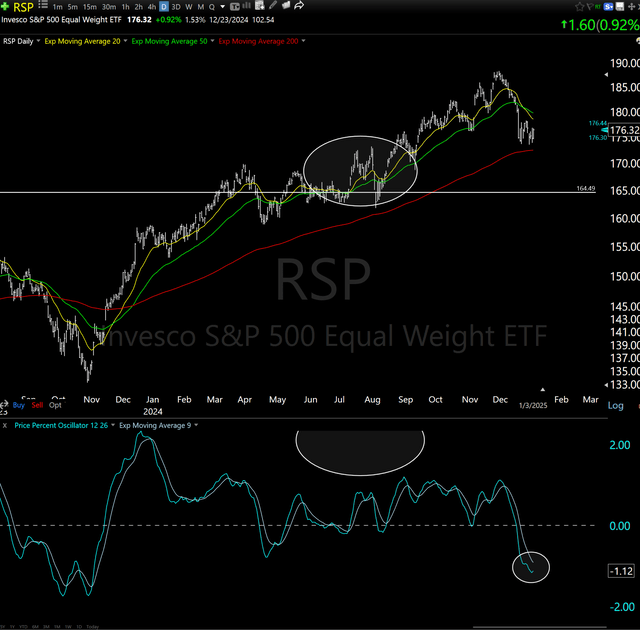
And here is the equal weighted S&P 500 ETF (RSP), which is down but showing faint hopes of bottoming in January. Not holding my breath. But this gap between the haves and have-nots is THE continuing story of the US stock market.
3 stock charts I’m watching
And, to get just a bit more granular, let's start 2025 off by charting the 3 stocks that combine to make up more than 20% of the ENTIRE S&P 500 index, as well as more than 26% of QQQ. And with the US now accounting for about 70% of the total world stock market value, these 3 companies add up to...wait for it...18% of the TOTAL GLOBAL STOCK MARKET (see ETF symbol VTI). OMG, that's a high risk/high reward predicament right there. So yeah, we should get a sense of what their pictures look like. If you invest in "stocks" these don't matter as much. But if you think of stock investing as participating in "the market" via S&P 500 index funds and the like, you can't go too far in either direction without these 3 having a big say.
AAPL
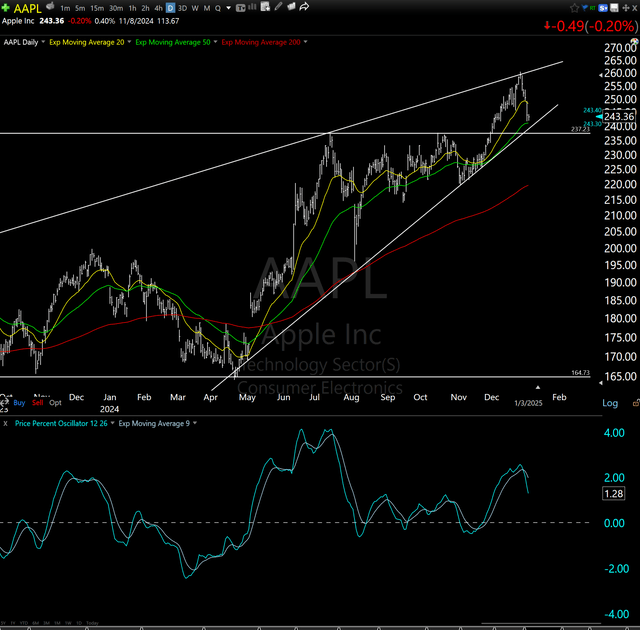
Similar to the S&P 500 chart shown above, in look and feel. And as with the S&P 500, the next major move is more likely down than up, similar to what things looked like just over 12 months ago (see left side of chart). But Mag-7 are winners until proven otherwise. Let's see if January brings some sort of "otherwise" to the table for us to consider.
NVDA
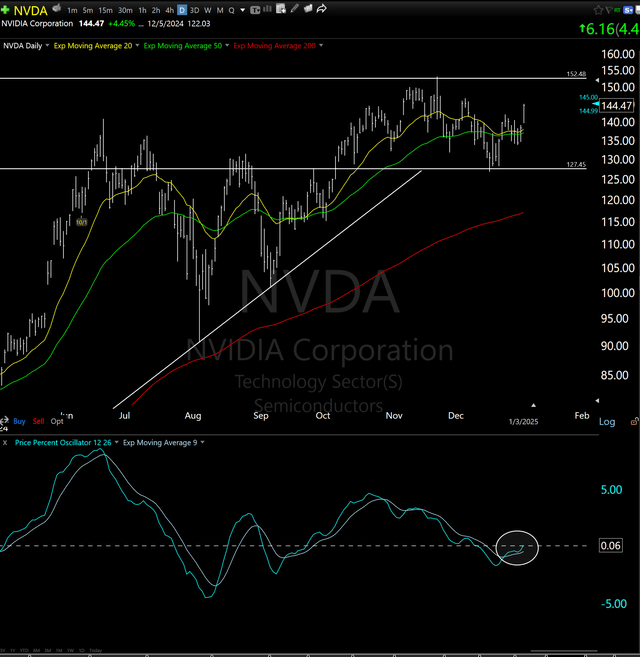
This one looks more likely to start 2025 up, since it has carved out a little "trading range" between $130 and $153. Yes, that's not so little. And the momentum indicator at the bottom of the chart hints at moving to a positive trend, but it is not there just yet.
MSFT
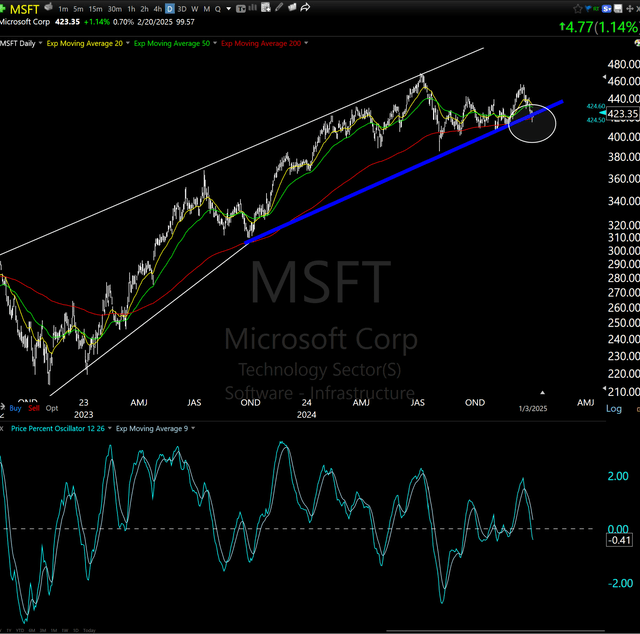
Of the 3 mega-stocks charted here, this one is the weakest, since it is already starting to break down. However, things don't work so cleanly, and it could be another in a series of "fakeout breakouts" we've seen in these most-favored stocks for more than 2 years.
Final thoughts for now
The holiday season is behind us, and I hope you had a great one! I have continued to watch things closely throughout, as our subscribers to the Sungarden YARP Portfolio investing group on Seeking Alpha know. As the year begins, we look forward to providing the same type of insight, and in a more compact, time-efficient manner, to our thousands of followers. We invite your questions, comments and feedback as we start another fulfilling year of deciphering and capitalizing on today's modern markets, and the opportunities they offer to the educated and informed.


