
Trending

Frequently asked question: “Rob, is this a market bubble?”
Rob’s answer: in some markets yes, and in others, no
Allow me to explain in the language I speak fluently…charting!
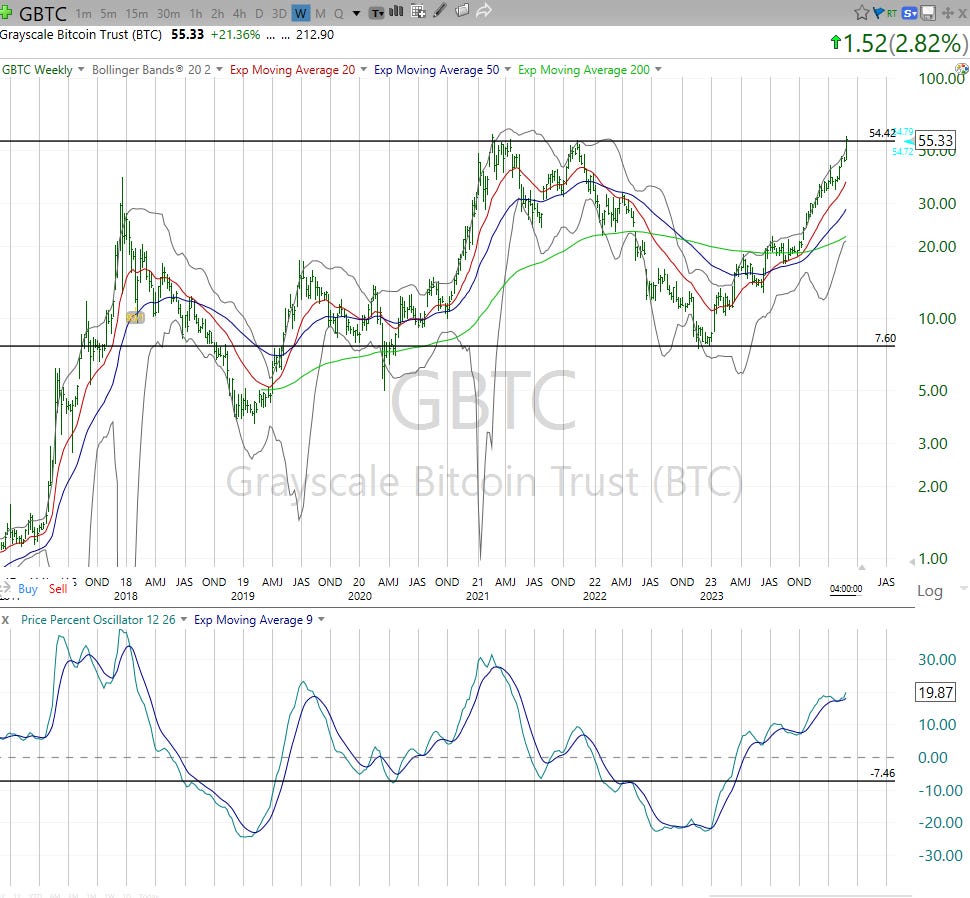
This is a bubble
GBTC is an ETF I chose to represent Bitcoin and crypto in general. It is flat over the past 3 years, but no one cares about that. After all it is near an “all-time high” with all the excitement and headlines that come with that. The lower part of the chart tells me that just because it is overvalued, it can get more overvalued before it is done. Yet, it can roll over at any moment. Worth the risk with a small portion of my total capital? I decided yes.
Bitcoin ETF trading (using ETFs and options) is not the type of thing you will find me talking about much because owning Bitcoin ETFs goes beyond the limits I’ve imposed on myself for the model portfolios at ETFYourself.com. But I have played with this bubble indirectly, as one of the current model holdings has exposure to some stocks in the blockchain business. So there are different degrees of “playing with bubbles.”
|
|
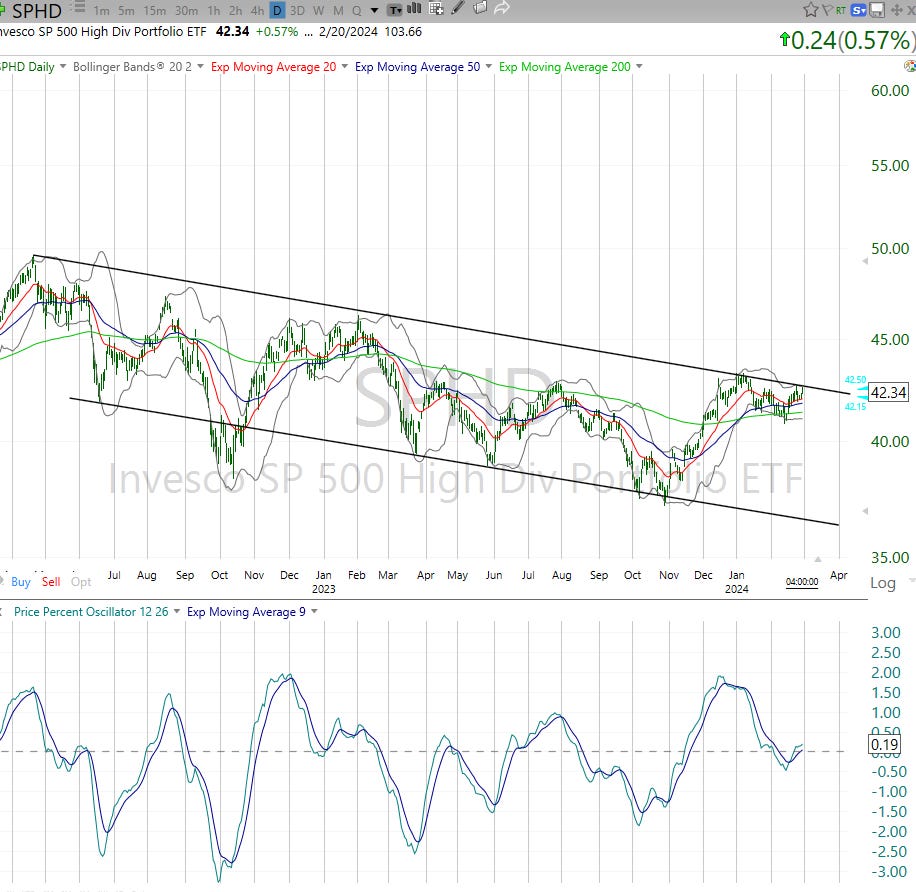
This is not a bubble
This ETF combines high-yielding stocks with the concept of lower volatility. That has not worked for a while. This is a steady downtrend, albeit with the potential to finally break out higher. Why? Top part of chart says “this is the line to cross” where I’ve drawn it. Bottom part of chart says, “just turned from weak momentum to strong momentum” (see far right side). Summary: dividend investors have had to put up with making practically zilch in the aggregate for a while, beyond the dividend. This ETF breaking out would be a sign that this could finally occur.
And ironically, that broadening of market beyond QQQ and Bitcoin could extend the bubble noted above. “Risk on” as they say. Let’s see what happens next.
|
|
How to play with bubbles
-
Recognize that they are bubbles
-
Know that there is a VERY strong likelihood they will one day "burst” and reverse a larger amount of the gains than anyone thought possible
-
No one knows when that bursting will happen, and if it will be an “event/shock/crash” or a slow burning fire
-
Bubbles provide very good profit-seeking opportunities for investors
-
The last stage of the bubble is frequently the one with the biggest gains
-
The key is to take a nimble approach AND stay humble and “within yourself.” Part of that is deciding before it is too late how much you are willing to risk “playing with bubbles”
-
This is where having a portfolio construction approach is MUCH better than simply “collecting a bunch of securities” which is a common issue I’ve seen the past few decades. As they say, fail to plan, plan to fail.
-
Currently, as always, my bubble-profiteering activities are in the “tail” portion of my portfolio, not the core or supporting parts. That is, I believe that it is best to take big risks with SMALL portions of the portfolio. That way, the upside I earn will be helpful to the overall “cause” but the downside risk won’t change my financial life.
-
Some ways to play with bubbles: ETFs that target the bubble areas; put and call options on ETFs and stocks. NOTE: these are likely to be the shortest-term holding periods in the portfolio. A week to three months is a likely range for how long I’ll hold. I don’t hyper-trade, but sometimes trading is where the extra return can be had. Or in a market like this, sometimes is can be the main source of return, since the majority of the market (stocks and bonds) go up and down but lead to nowhere.
-
ETFYourself.com is all about portfolio construction and risk management!
The ETFYourself.com Depth Chart
 |
It was easy to decide which of this list of 10 major market indicators to highlight this week. RSP may be overvalued like much of the stock market, but is showing greater signs of a potential bubble-like up move than anything else on the list.
As noted in previous weeks, these are shorter-term indicators and thus less reliable than longer-term technical measures I use. But with the equal weighted S&P 500 ETF now within about 2% of its early 2022 high, if this one breaks out, it will mean a lot more to me than when SPY did. Because it will signal that the “bubble” is becoming more inclusive.