Boxer and unlikely star of the “Hangover” movie Mike Tyson has a often-quoted expression on Wall Street. Everyone has a plan…until they get punched in the face.
Boxers get that, since every one who has ever been in the ring (not me!) has experienced that. Investors understand this in the proverbial sense. And, if you have been around more than a few years, you may feel the same way I do about quarterly earnings season. This is when public companies go public, about their performance during the past quarter, and about their outlook for the future. It should be informative.
It used to be. And then, like many Wall Street traditions, it became an “event.” I don’t mean like a birthday party for a dear friend. I mean like a professional wrestling match. As a result, all that focus on not only how a business is doing, but on whether its operating performance and outlook “met analysts expectations” is a game I wish I didn’t have to play.
ETFs help us play Wall Street’s modern “game”
ETFs help us play with more cushioning, since they are diversified. But what happens during these 3-4 intense weeks each quarter referred to as earnings season can dramatically alter the price of individual stocks, industries and even sectors. And it is not something you can plan for. Stocks with great charts can “miss” earnings and drop 10%. Others can produce awful results but if they are less awful than “expected,” then the stock can pop.
This Thursday note focuses on technical analysis, and this earnings = event thing has a decided impact on charting and chartists like me. It screws with everything. What I’ve learned over the years is to expect that, and to consider many of the huge gaps up and down in price to be somewhat meaningless until another week or two has passed. Because the first reaction to earnings announcements is often not the ultimate move of consequence for investors.
That’s why, as much as I like and use short-term charts alongside long-term charts, I don’t do anything without knowing what the weekly-price picture looks like. I have repeated to myself many times during earnings season, “remember Rob, the weekly charts are the truth, and everything short-term is helpful but more likely to be noise.” And in all aspects of investing, it really helps one’s investing and sanity to crowd out the noise, difficult as it can be during “the season of my discontent” known as earnings season.
7 of a kind?
But hey, this time of the quarter is not necessarily bad. It is more annoying than anything else. But it also produces some pretty cool short-term results at times. As has been the case many times in the strategic approach I take to portfolio construction, today in our 7-ETF model, all 7 ETFs holdings were today. That would be no big deal if they were all stock ETFs, since all 4 major US stock indexes were up today. But what makes it notable is that the portfolio is a mix of long, short and cash-like ETFs. The longs and the shorts were both up.
Now, don’t read much into one day. It is the concept I am emphasizing here. Hedging is NOT just about risk-management. It can also be a way to “win both ways.” Consider that for most of last year, one part of the stock market was way up and others were way down. Just recently, Japan was on a huge run, yet China was sliding.
There is opportunity everywhere, especially when ETFs are used the way they can be. ETFYourself.com’s mission is to help investors realize this, and learn how they can use them in ways they may have never imagined.
The ETFYourself.com Depth Chart (free version)
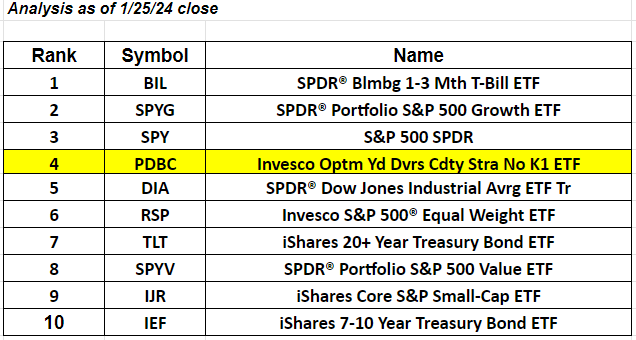
Above is our weekly snapshot look at the major markets. Summary at VERY basic level, and with slim margins between many of these market segments:
-
Growth looks better than value
-
Large cap looks better than small cap
-
Stocks look better than bonds
-
T-bills look better than all of them, though a small segment of the stock market (the same stuff that dominated last year) is lifting off. For how long? We’ll see. But the rest of the stock market is not tagging along very much at all.
Highlighted segment of the week (noted in yellow above)
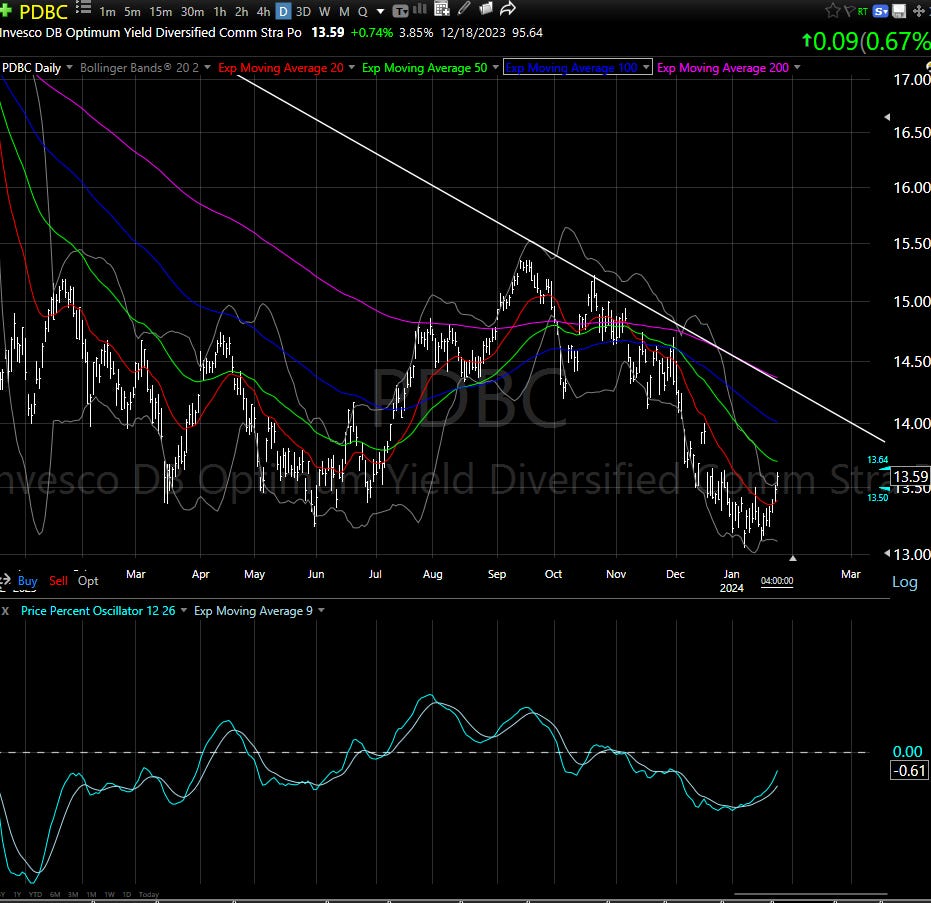
Commodities are “early” but as those who attended our “Charty Party” last Tuesday night heard me discuss, this is what I look for in a potential turnaround situation. The price of PDBC (upper part of chart) is trying to rally off a familiar base level ($13-ish), and the bottom of the chart (PPO momentum indicator) looks very encouraging.
Related: The S&P 500 That Wasn't


