
Trending

Written by: Matthew J Bartolini, CFA, CAIA | SSGA SPDR
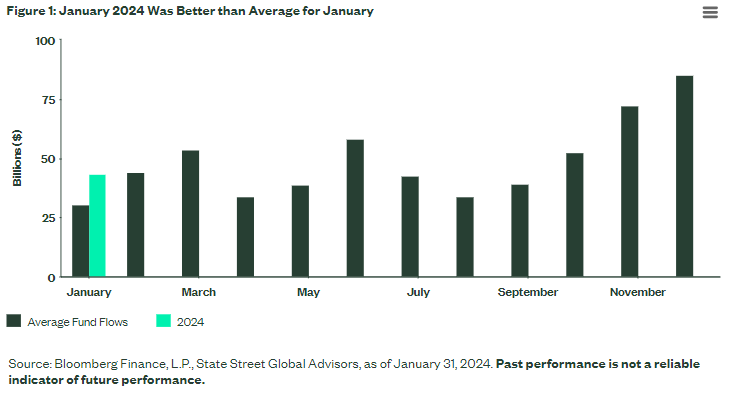
- Historically the month with the lowest inflows, January’s $43 billion beat the January average by $13 billion.
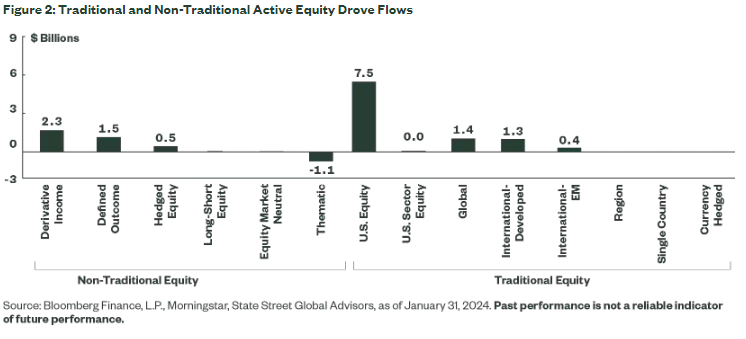
- Equity ETFs added $23 billion, a record consecutive 21 months of inflows. Active equity made up 58% of this total.
- Bond ETFs’ $21 billion in inflows included $12 billion into risk-on credit ETFs. Ultra-short government ETFs had outflows of $3 billion.
January came in like a lion and went out like a lamb. After roaring into the new year on the heels of December 2023’s record ETF inflows, January ended with an equity selloff driven by uneven earnings reports and less than exuberant guidance from mega-cap tech leaders.1
That’s nothing out of the ordinary. Seasonal buying patterns — window-dressing, beta chasing, tax-loss harvesting, and other tax-motivated drivers — historically have made December the strongest month for ETF inflows and January the weakest.
But better than usual performance across asset classes pushed this January’s inflows to $43 billion. That’s $13 billion more than January’s average (Figure 1), but still 12% lower than ETFs’ average monthly inflow of $49 billion.2
What drove January’s better than average inflows?
- Low-cost core exposures, less susceptible to the seasonality rip and dip than tactical ETFs, took in $41 billion — 94% of all ETF inflows.
- Active ETFs added an all-time record $20 billion, 47% of ETF inflows. In addition to traditional and non-traditional active equities (Figure 2), active fixed income ETFs added $5 billion, their third-best month ever.
Risk-On, With a Preference for Credit
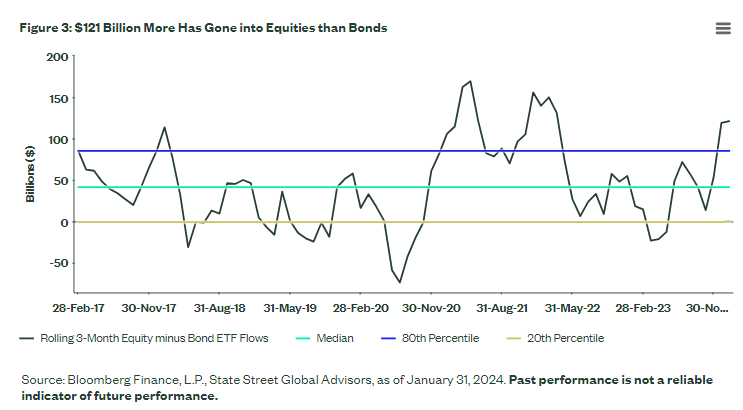
Although bonds’ $21 billion in January came close to equity ETFs’ $23 billion, positioning remains bullish over the longer term.
Over the past 90-days, equity funds took in $121 billion more than bonds. This rolling 90-day flow differential in the 90th percentile illustrates continued risk-on positioning (Figure 3). A fact underscored by equity funds’ record 21 consecutive months with inflows.
Also, plenty of bond inflows had a risk-on vibe, making the overall positioning more upbeat than it first appears. Risk-on credit-related exposures (IG corporates, high yield, and senior loans) took in a combined $12 billion in January, led by $8.7 billion into IG corporates, their third-best ever for a month.
The interest in credit can be boiled down to investors seeking an implicit equity exposure with lower volatility on the hope that the Fed can engineer a soft landing without too many bumps.
Other fixed income trends include continued outflows from short-term government funds and renewed interest in mortgage-backed funds. If mortgage rates continue to revert closer to long-term averages on the back of a more dovish Fed, that could continue to benefit the sector and keep flows positive into mortgage-backed ETFs.
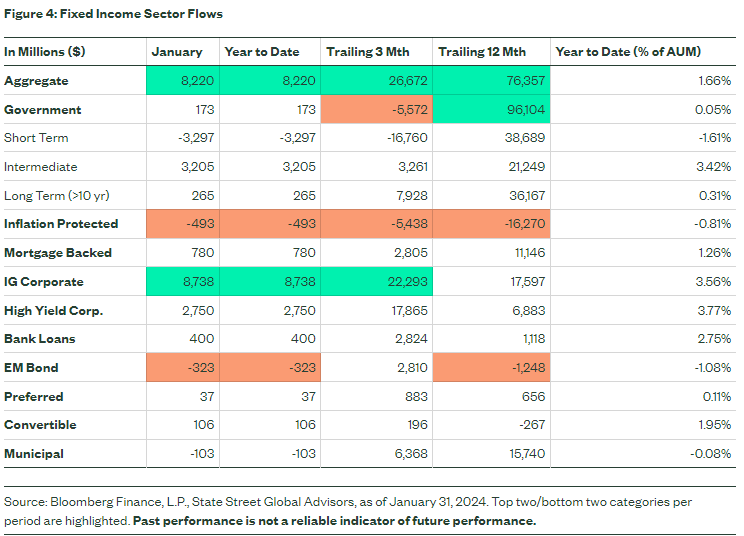
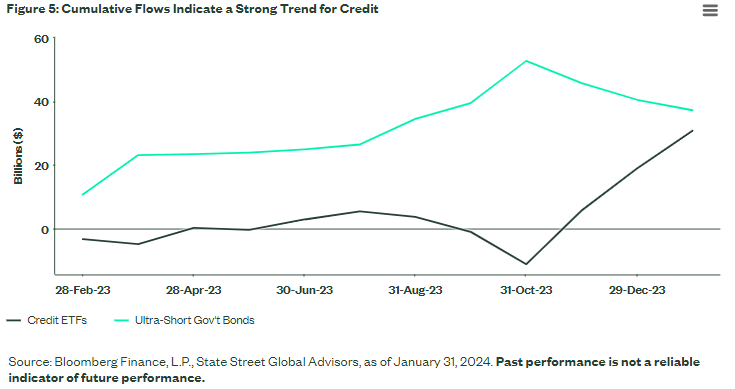
Risk-on positioning within fixed income and the preference for credit over defensive bonds is most apparent in the cumulative flow trends between the ultra-short and short-term government bond sector and credit related ETFs (IG corporate, high yield and senior loans).
After moving in different directions throughout most of 2023, they have nearly converged following the $42 billion into credit and $16 billion out of short-term government bond funds over the past three months (Figure 5).
Equity Positioning: Toward Growth, Away From China
In the US, Growth beat Value with $7 billion in inflows. Growth funds are now on a record streak of 12 consecutive months with inflows. Clearly, a trend to buy growth in a market devoid of earnings growth (2023 EPS growth is still expected to be negative after Q4 results hit).3 That’s consistent with $3 billion going into tech versus combined outflows for the rest of the sectors.
Developed ex-US equity ETFs notched their record 43rd consecutive month in a row with inflows. Japan (+$1.8 billion) led single-country flows, followed by India (+$415 million), and South Korea (+$306 million), as investors looked to Asia for tactical country exposure.
But China-focused ETFs lost $304 million and now have $3 billion of outflows over the past year. Notably, 87% (+$886 million) of the $995 million flowing into emerging market (EM) ETFs went into funds with an investment objective that targets EM nations ex-China.
Navigating the Market’s Animal Spirits
The resetting of expectations fueled a selloff on the last day of the month, with the S&P 500 Index posting its worst daily return since September.4 But momentum from earlier in the month helped US stocks finish with a third straight monthly gain.
January’s trading behavior reflects two major trends that investors will have to grapple with this year:
- Fragile fundamental momentum, where growth is concentrated among a few names (ex-Magnificent Seven growth is projected to be low single digits through Q3 2024) with more downgrades than upgrades across the globe.5
- Evolving and ambiguous monetary policy expectations that are likely to keep rate volatility elevated and bond portfolios challenged.
So amid the lions and lambs, doves and hawks, bears and bulls, where should investors look for opportunity now?
Consistent with our 2024 ETF Market Outlook, seek to target durable growth with quality US equities, while using flexible active bond strategies in and out of the core to traverse the challenging fundamental and macro terrain.
Related: Making Higher-Income People Pay for Social Security Shortfalls
1 Bloomberg Finance L.P. as of January 31, 2024.
2 Bloomberg Finance, L.P, as of January 31, 2024.
3 Bloomberg Finance L.P. as of January 31, 2024, based the S&P 500 Growth and Value Indexes.
4 Bloomberg Finance L.P. as of January 31, 2024.
5 FactSet as of January 31, 2024.