
ETF investing has revolutionized wealth management largely for the better. Clients are no longer paying so many excessive fees for transactions, Advisors can adjust portfolios intraday, and there are thousands of new investable securities to give your clients an advantage. One suggestion that will better align your investments with your goals and your clients’ investments with their goals is to check under the hood of the ETF: ALWAYS check the underlying holdings of the ETF.
Many advisors look (rightly) at the expense ratio to make sure the fee on the ETF is competitive. Some advisors go further and check the daily volume to confirm liquidity is appropriate for the size of the transaction. Many stop there, believing the ETF’s name represents its true underlying holdings. Not all ETFs are created equal and there are times when an underlying holding can significantly impact the ETF. Let’s look at some examples.
Below are two comparisons of the top S&P 500 ETFs. These ETFs are designed to track the S&P 500 as closely as possible. The daily fluctuations of these two ETFs is very close to the S&P 500 but not exact. Interestingly, the underlying holdings are slightly different from a percentage standpoint.
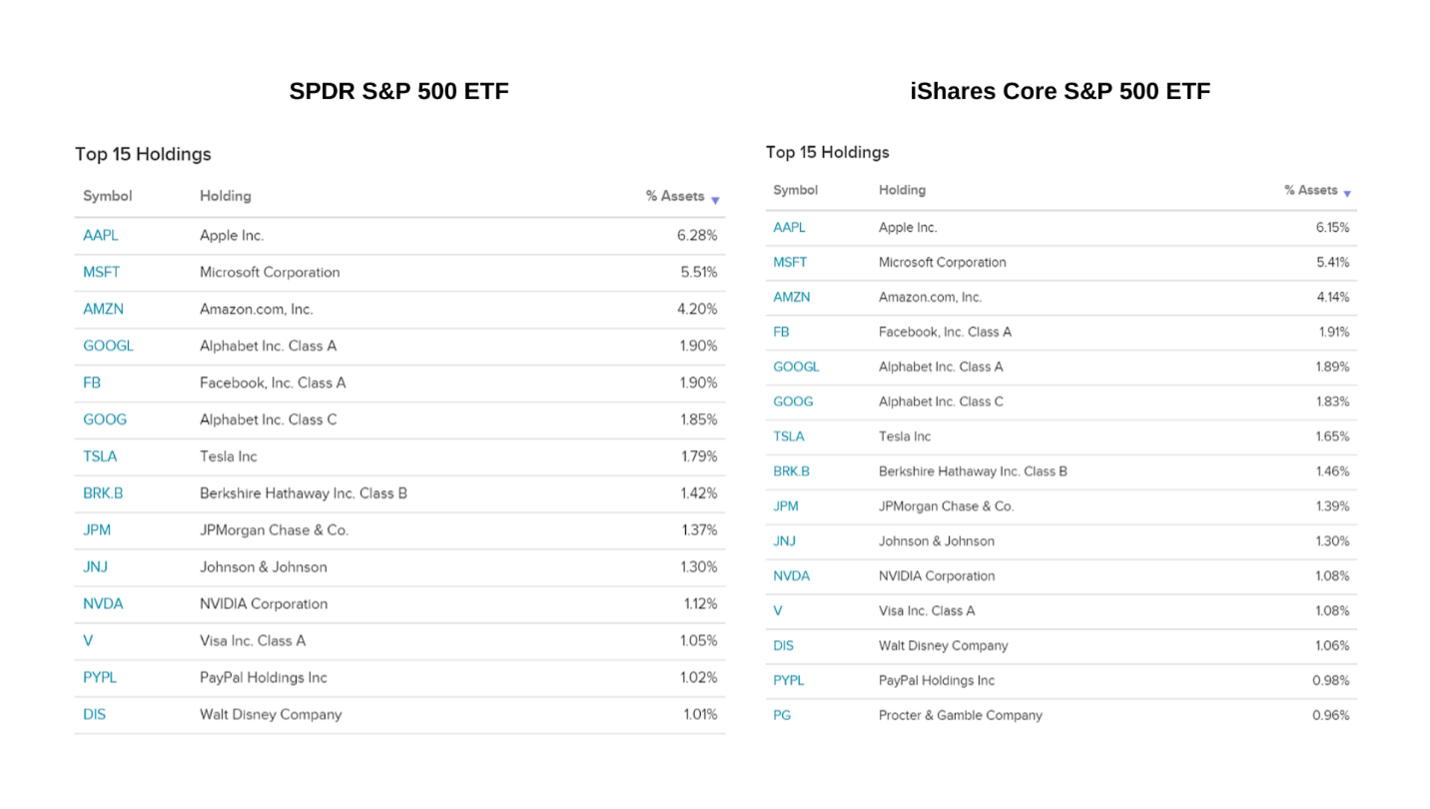
Source: etfdb.com
While both of these do an exceptional job tracking the S&P 500, it is of note that the ratios of each holding are different. Many of these ETFs are built using a market cap weighting of each underlying individual security. As these security market caps fluctuate, the percentage of assets the underlying security makes up of the total ETF will change. Currently, there is an ongoing example of how this may impact your clients.
Let’s say you are looking to invest in US Retail through an ETF because you believe the future of the retail industry is strong, given your or your client’s time horizon. You see symbol XRT, SPDR S&P Retail ETF. This seems like a safe way to invest in the broad US retail market to most. Because of the recent and ongoing GameStop short squeeze, your top holding would in fact be GameStop! Entering Thursday, GameStop accounted for 3.05% of the weighting of this ETF and with another squeeze sending the price up 200%, this will likely be a much larger holding. Let’s look at Gamestop’s price action compared to XRT over the last month.
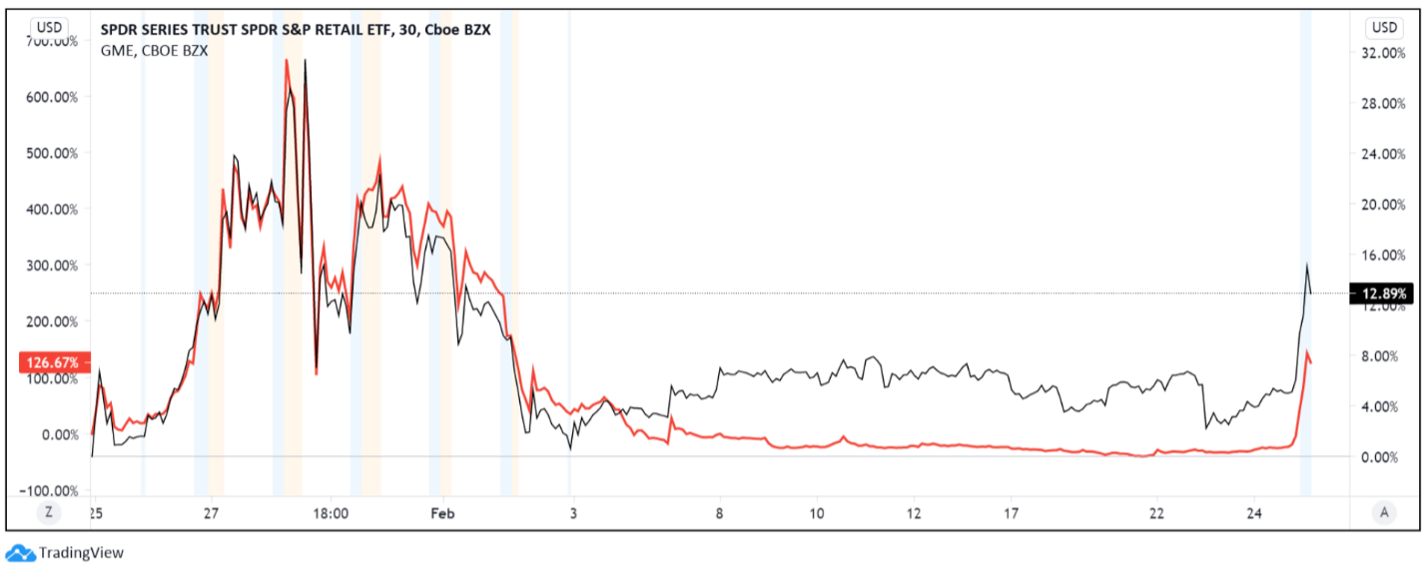
Source: TradingView
In this graph, GameStop is pinned to the left axis while XRT is pinned to the right axis. As you can see, XRT has nearly mirrored GameStop, one of the most volatile stocks in the market right now. Has US retail really moved +30%, -20+%, and now back up about 13% over the past month? No. This is a case of an underlying holding becoming so disconnected with fundamentals that it is severely impacting this ETF. If one had not done the research, an advisor may have put clients into an unnecessary risk. Likewise, it is important to analyze the underlying holdings of ETFs you and your clients are currently invested in. Before this squeeze, this ETF functioned well and was a favorite for those looking to invest in US retail.
The moral of the story is always check under the hood! Look at the top holdings and make sure these align with the investment goals of yourself and your clients. This small step could save you from excessive risk exposure.