
Trending


What is this chart showing?
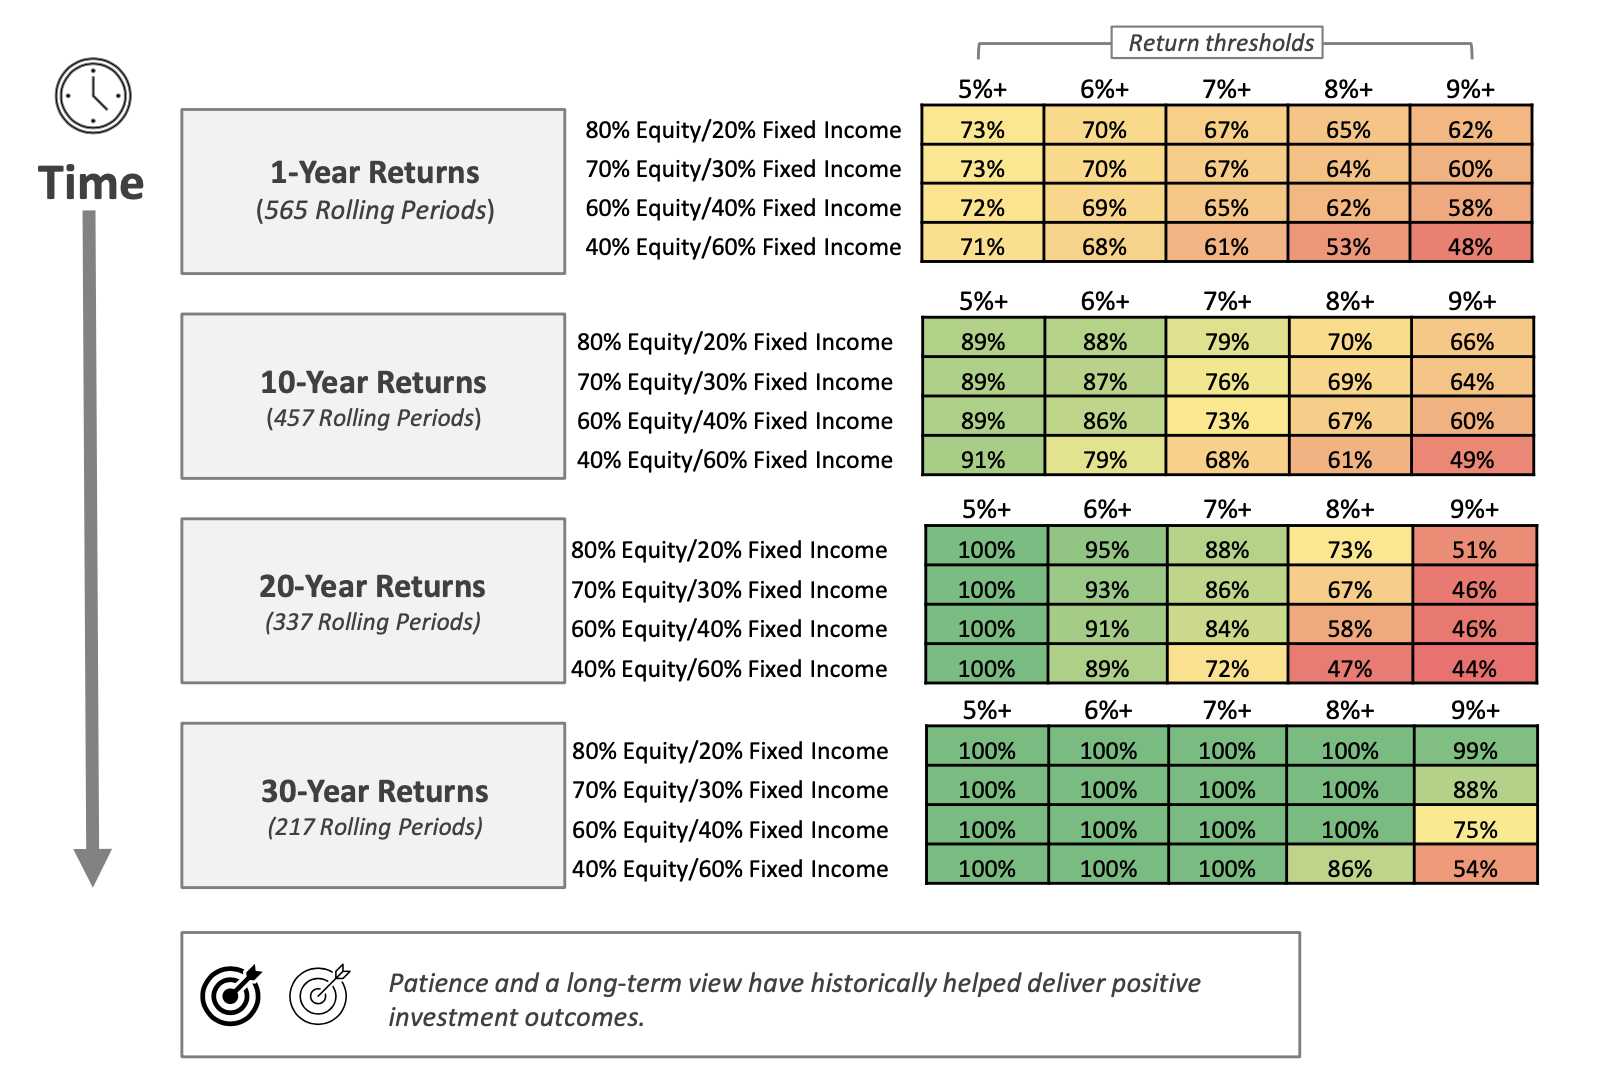
This chart shows the percentage of times the return of several hypothetical mixes of U.S. stocks and bonds were equal to or above specific thresholds over 1-, 10-, 20- and 30-year rolling periods from 1974 through 2023.
Why is it important?
As time in the market increases, so does the historical frequency of surpassing various annual return targets.
For example, an 80/20 mix of stocks and bonds surpassed a 7% return in 67% of one-year holding periods. However, when that holding period was extended to 30 years, 100% of historical outcomes generated a return of at least 7%.
Related: The Importance of Your Response to Market Volatility
Source: Morningstar. Equity = S&P 500 TR. Fixed Income = Bloomberg U.S. Aggregate Index TR. 80/20 portfolio = 80% S&P 500 TR and 20% Bloomberg U.S. Aggregate Bond Index TR. 70/30 portfolio = 70% S&P 500 TR and 30% Bloomberg U.S. Aggregate Bond Index TR. 60/40 portfolio = 60% S&P 500 TR and 40% Bloomberg U.S. Aggregate Bond Index TR. 40/60 portfolio = 40% S&P 500 TR and 60% Bloomberg U.S. Aggregate Bond Index TR. Rolling returns are annualized on a 1-, 10-, 20-, and 30-year basis. Using monthly S&P 500 Total Return and Bloomberg U.S. Aggregate Bond Index Total Return data starting in January of 1976, summary return statistics were calculated based on the total number of rolling return periods existing for each given period of time with a one-month step. Past performance is not indicative of future returns.