
Trending

From: Dimensional Fund Advisors
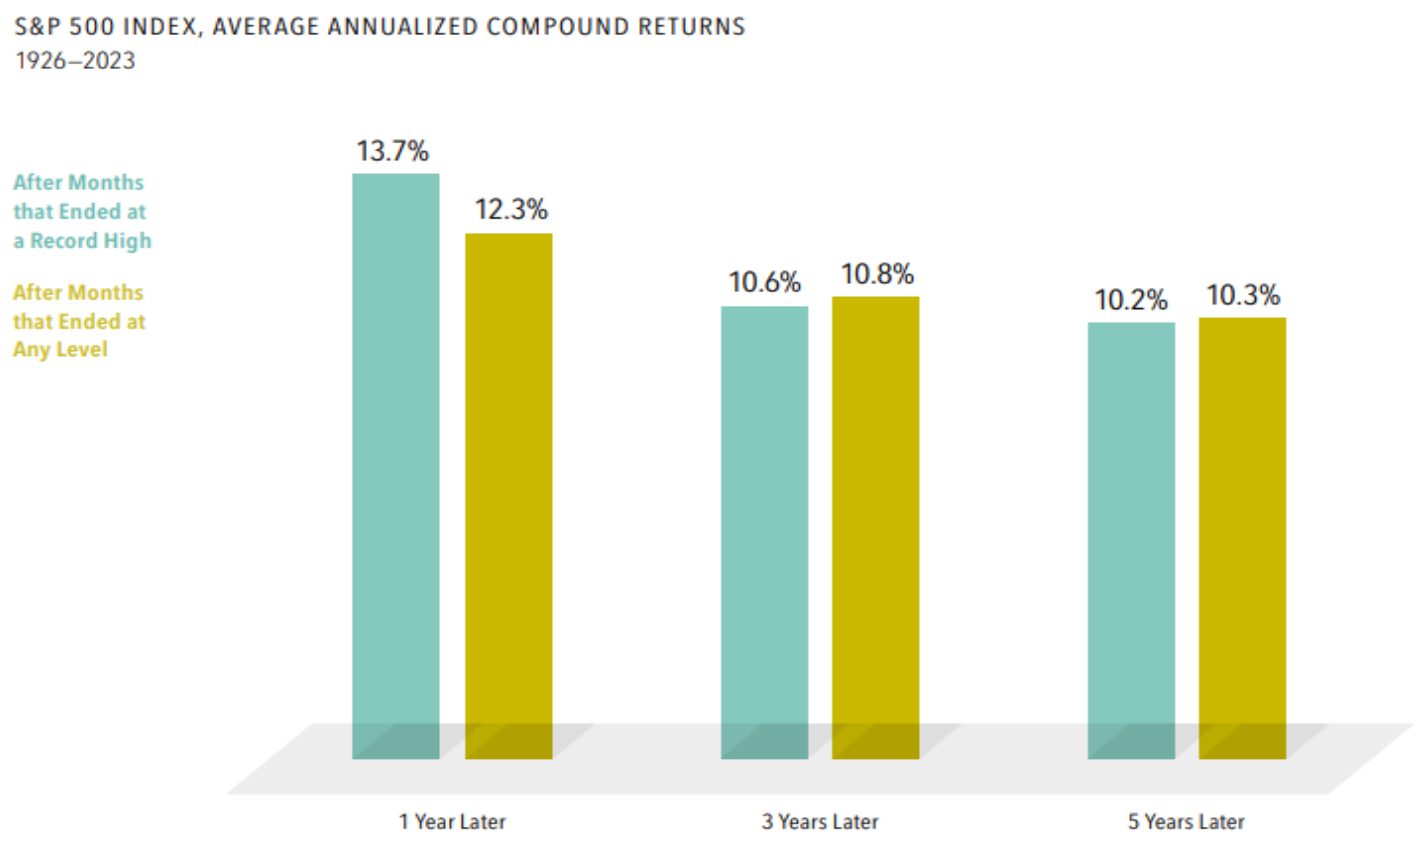
Many investors may think a market high is a signal stocks are overvalued. However, they may be surprised to find that the average returns one, three, and five years after a new month- end market high are similar to those after months that ended at any level.
In looking at all monthly closing levels between 1926 and 2023 for the S&P 500 Index, 31% of them were new highs. After those highs, the annualized returns ranged from almost 14% one year later to more than 10% over the next five years, which were close to average returns over any period of the same length.
Stocks are priced to deliver a positive expected return for investors, so reaching record highs regularly is the outcome one would expect.
Related: The Markets and U.S. Presidential Elections
Source: Dimensional. Reprinted with permission from Dimensional. Past performance is no guarantee of future results. Indices are not available for direct investment. Their performance does not reflect the expenses associated with the management of an actual portfolio. In USD. For illustrative purposes only. New market highs are defined as months ending with the market above all previous levels for the sample period. Annualized compound returns are computed for the relevant time periods subsequent to new market highs and averaged across all new market highs observations. There were 1,175 observation months in the sample. January 1926–December 1989: S&P 500 Index; Stocks, Bonds, Bills and Inflation Yearbook (total return), S&P data © 2024 S&P Dow Jones Indices LLC, a division of S&P Global. All rights reserved. Dimensional Fund Advisors LP is an investment advisor registered with the Securities and Exchange Commission.