
What is this chart showing?
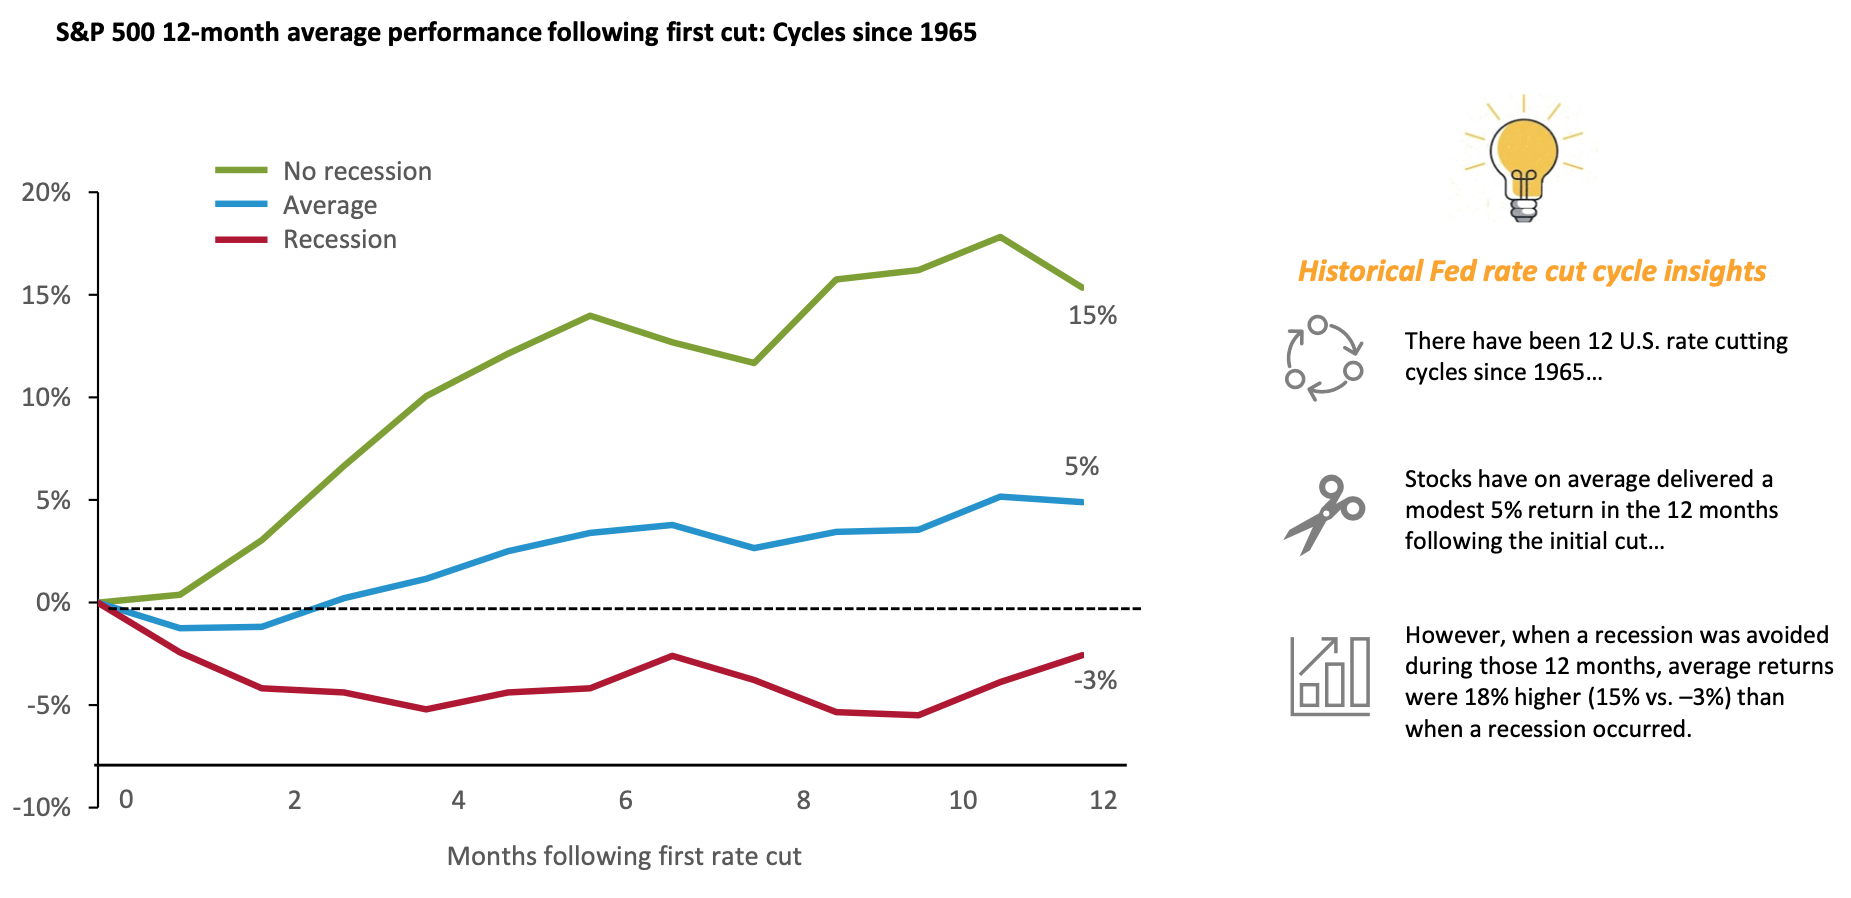
This chart shows average S&P 500 returns in the twelve months following the first rate cut by the U.S. Federal Reserve in previous cycles.
Why is it important?
Based on recent messaging from the Fed, a pivot in policy may be on the horizon.
What this could mean for equity markets is likely to come down to the state of the U.S. economy.
History shows that on average, returns in the twelve months following the first rate cut are positive, but roughly half the long-term average of stocks.
However, there is a stark difference in results during times where the economy avoided a recession throughout these twelve months, versus those when a recession occurred.
Related: Stocks Rise Far More Often Than They Fall
Source: Federal Reserve, NBER, Bloomberg Finance L.P. Analysis provided by J.P. Morgan as of December 11, 2023. Analysis incorporates cutting cycles that began in: Nov '66, Aug '69, June '74, May '81, Oct '84, Jun '89, Jul '95, Sep '98, Jan '01, Sep '07, Jul '19, and Mar '20. Recession is determined by an NBER-defined contraction that occurred within 12 months of the first cut, excluding the 2019 cycle preceding the COVID-19 pandemic. Past performance does not guarantee future results.
LCN-6693388-061224