From: DoubleLine
This summer’s spike in volatility provided many noteworthy developments. One of the most interesting was the unwinding of the so-called “yen carry trade” that shook currency markets throughout July and August.
For those unfamiliar with currency trading, the carry trade is a strategy where investors borrow or sell the currency of a country with low interest rates and lend or invest in the currency of a country with high interest rates. By shorting the lower-yielding currency and buying the higher-yielding one, investors capitalize on the yield differential. A well-known example of a funding currency is the Japanese yen, which has maintained an interest rate of 50 basis points (bps) or lower for almost three decades.
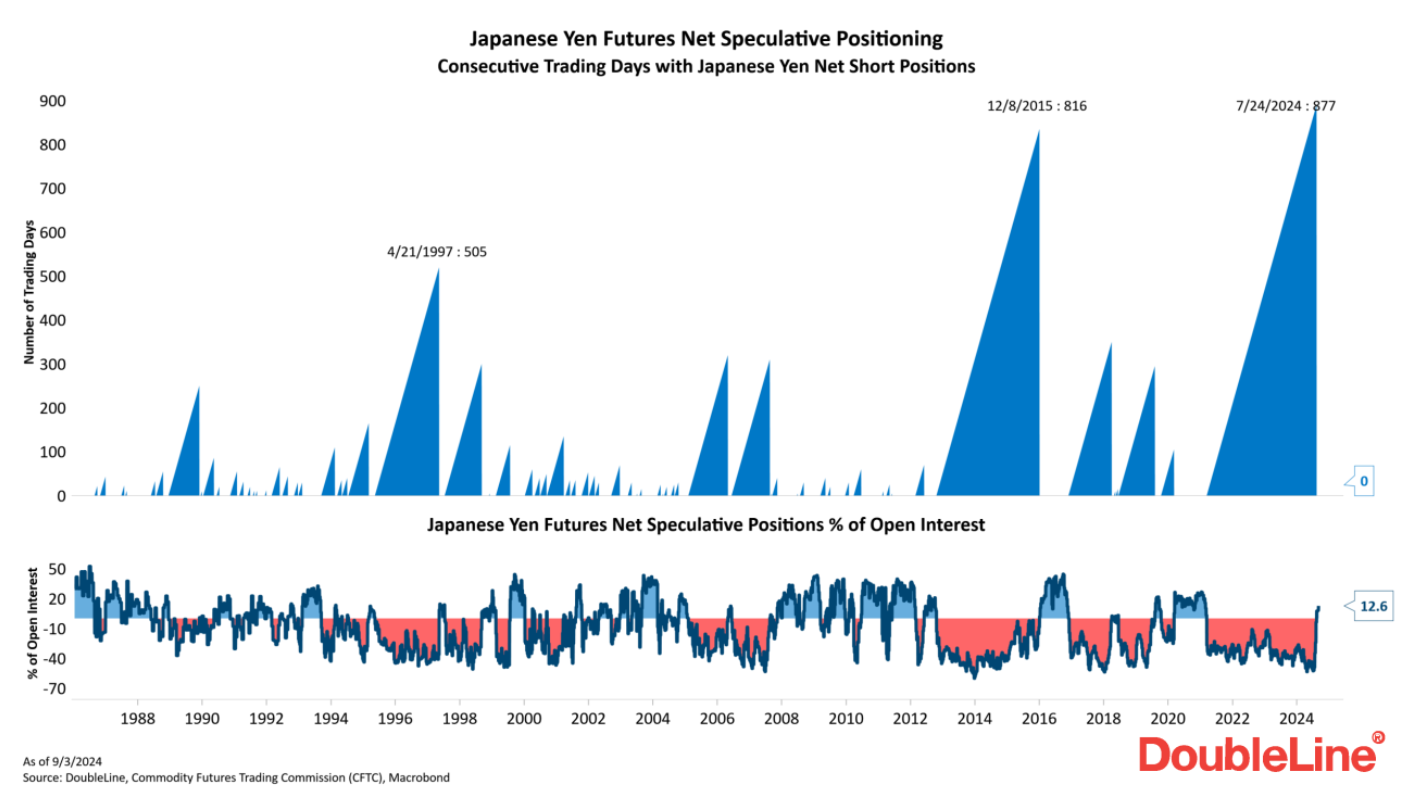
Over the last few years, investors have capitalized on the yield differential between Japan and the U.S. by shorting yen and buying U.S. dollars. This week’s chart shows the net speculative positions in Japanese yen futures based on data from the Commodity Futures Trading Commission. The upper panel shows the number of consecutive trading days with net short positions in the yen. The net speculative positioning in the yen offers a window into the magnitude of the yen carry trade. Not only was short positioning in the yen at an extreme, but its duration reached a record 877 consecutive trading days on July 24. This data suggests growing investor complacency regarding yen shorts. Perhaps the complacency was well deserved, with the yen having depreciated over 36% versus the dollar since the start of 2021 to June 2024.
But the carry trade and those yen shorts faced a test in July and August. U.S. economic data began softening, and markets priced in more aggressive cuts from the Federal Reserve. Meanwhile, the Bank of Japan (BOJ) was embarking on its first rate-hiking cycle since 2007. At its July policy meeting, the BOJ hinted that further “normalization” of policy would be likely. The U.S.-Japan yield differential narrowed, and global assets faced selling pressure, forcing leveraged positions, including carry trades, to unwind.
The yen depreciation halted abruptly as the currency rallied 13.6% versus the dollar from its July low, driven by short covering in July and August. As shown in the bottom panel of the chart, net positioning in the yen turned long, indicating the yen carry trade has largely been unwound. While much of the yen short covering has taken place, seasonally higher volatility in global risk assets coupled with the upcoming start of a Fed interest-rate cutting cycle this month might place further upward pressure on the yen.


