Presidential approval ratings and market performance
What is this chart showing?
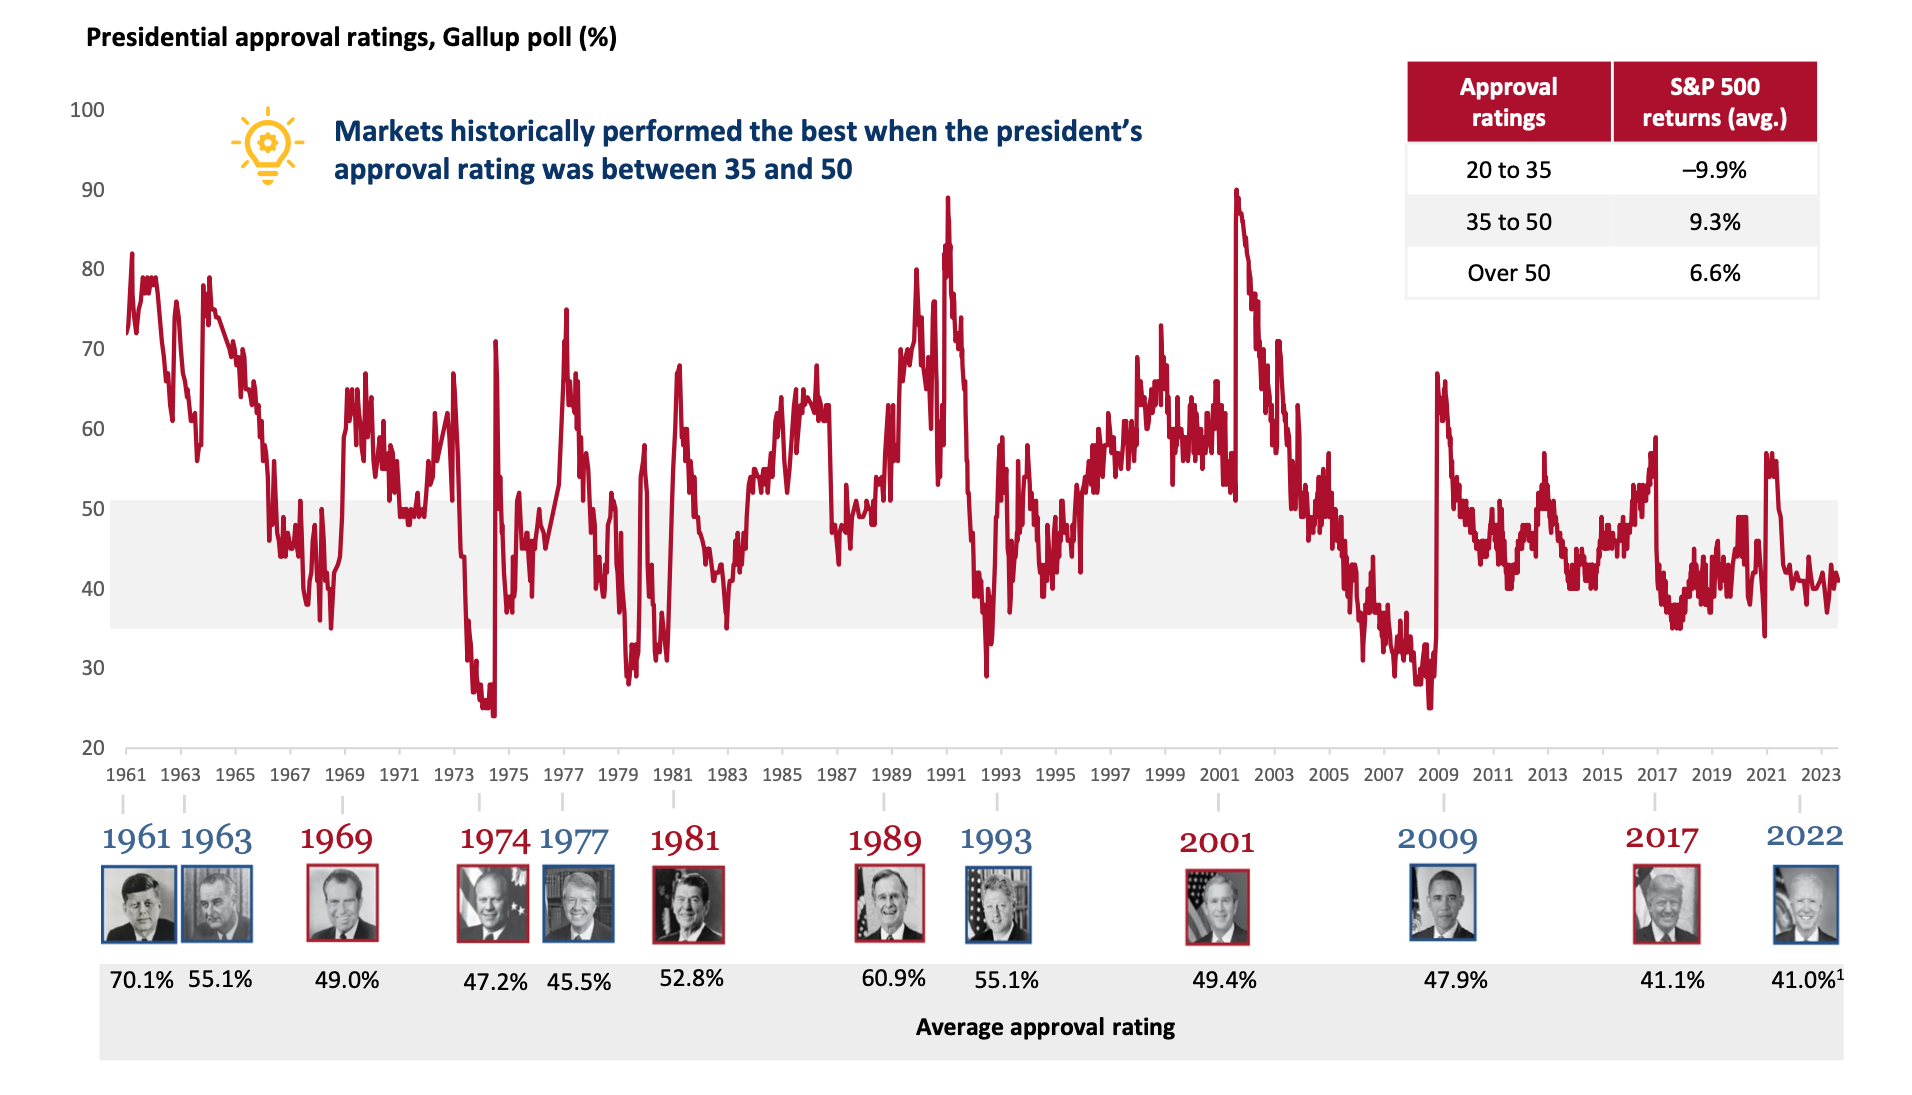
This chart shows the average presidential approval ratings from 1961 through September 30, 2023, as well as the average historical market performance under different presidential approval rating ranges.
Why is it important?
Investors don’t need to agree with political agendas to do well in the markets. In fact, some of the best returns in the market happened when approval ratings were between 35% and 50%. In other words, strong returns came even when less than half the country approved of the current administration.
Source: Presidential portraits. Library of Congress, https://www.loc.gov/free-to-use/presidential-portraits. Invesco.
Bloomberg, Gallup. Data as of 9/30/23. 1Biden approval rating as of 9/30/23. Past performance is not indicative of future returns. Index performance is for illustrative purposes only. You cannot invest directly in the index.


