
Trending

What is this chart showing?
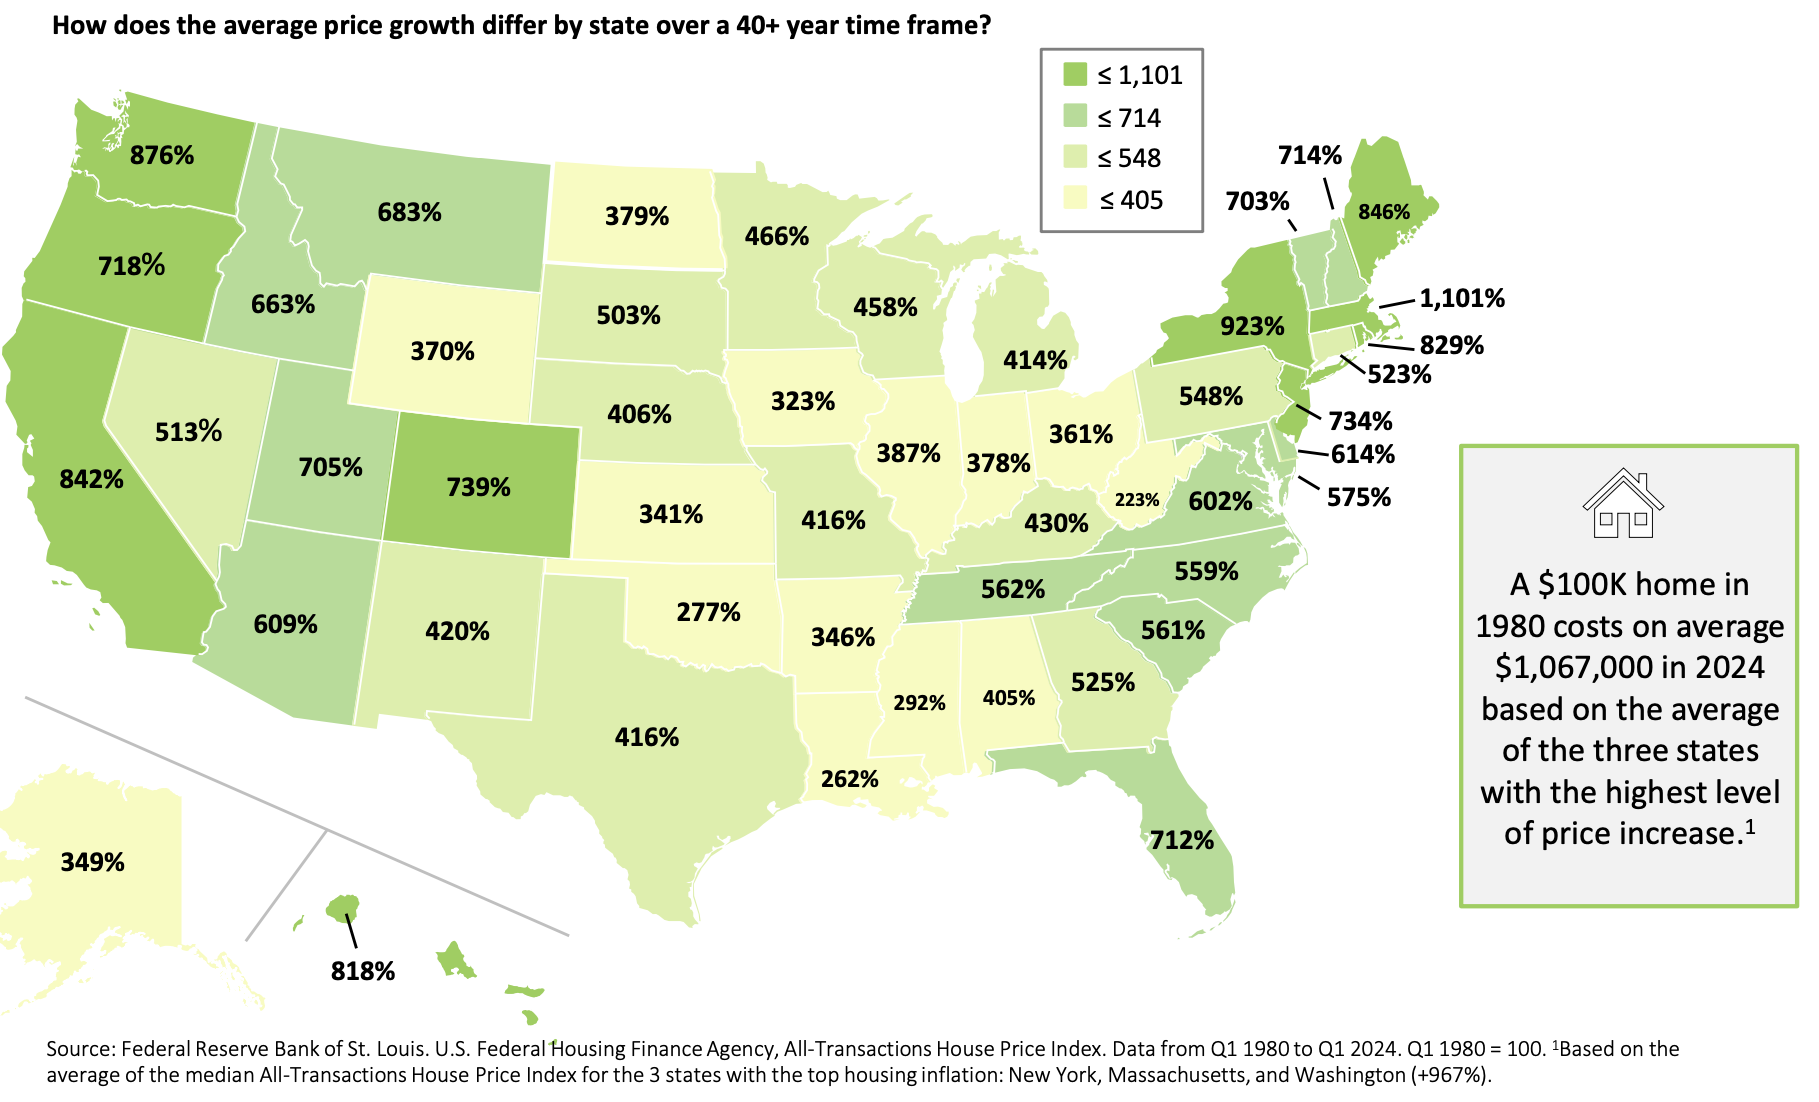
This chart shows the average percentage increase in home prices across the United States from Q1 1980 to Q1 2024.
Why is it important?
U.S. home prices have soared in recent decades. However, growth has been uneven across states, with coastal areas experiencing the largest price increases.
By considering location-specific growth in land trends, investors can make informed decisions about estate planning to ensure they align with their long-term goals.
Related: Stocks Rise Far More Often Than They Fall
LCN-6693388-061224