
Trending

What is this chart showing?
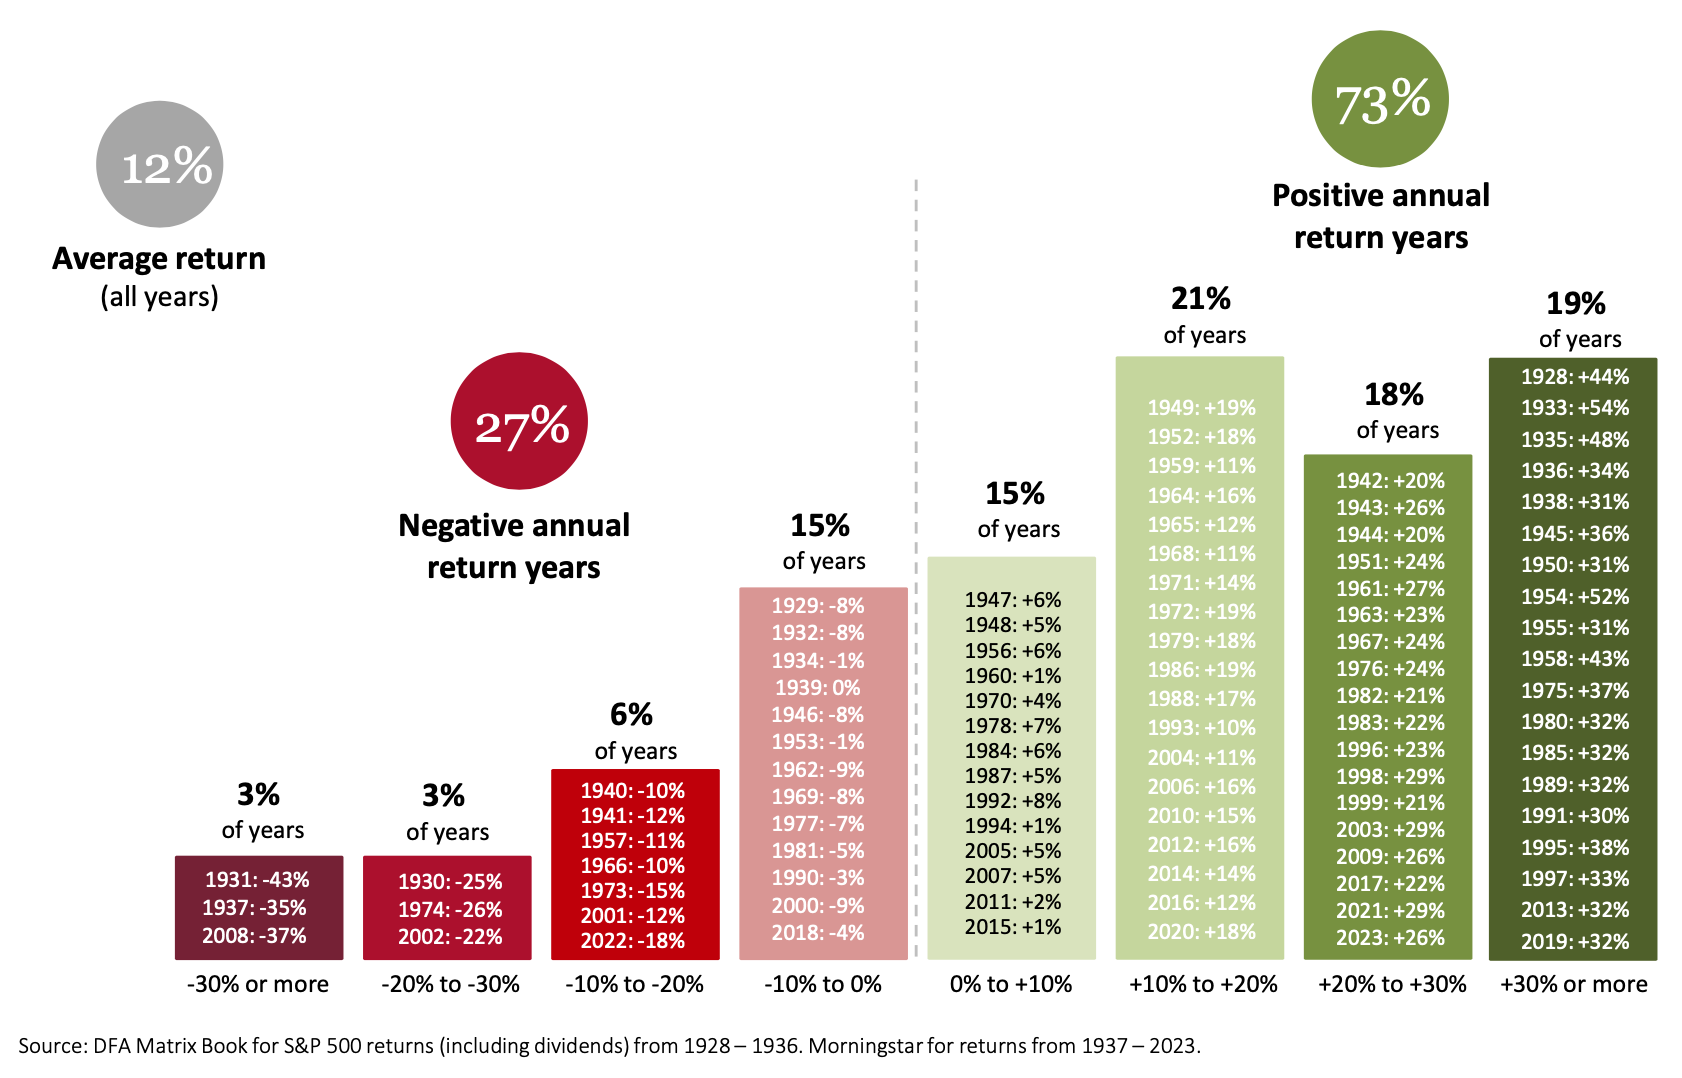
This chart shows the distribution of calendar year returns for the S&P 500 Index from 1928 through 2023.
Why is it important?
While the market has certainly suffered down years, they’ve been far outweighed by good – and even great – ones.
From 1928 to 2023, the average calendar year return for the S&P 500 Index was 12%.
Over that timeframe, 73% of yearly returns were positive while only 27% experienced a negative return.
Not only has the market risen far more often than it has fallen, many of the worst years for stocks were followed by strong rallies – rewarding investors who chose to stay the course.
Past performance is not indicative of future returns. Index performance is for illustrative purposes only. You cannot invest directly in the index.
Related: The Long-Term Outlook for Social Security
LCN-6693388-061224