Stocks rise far more often than they fall
What is this chart showing?
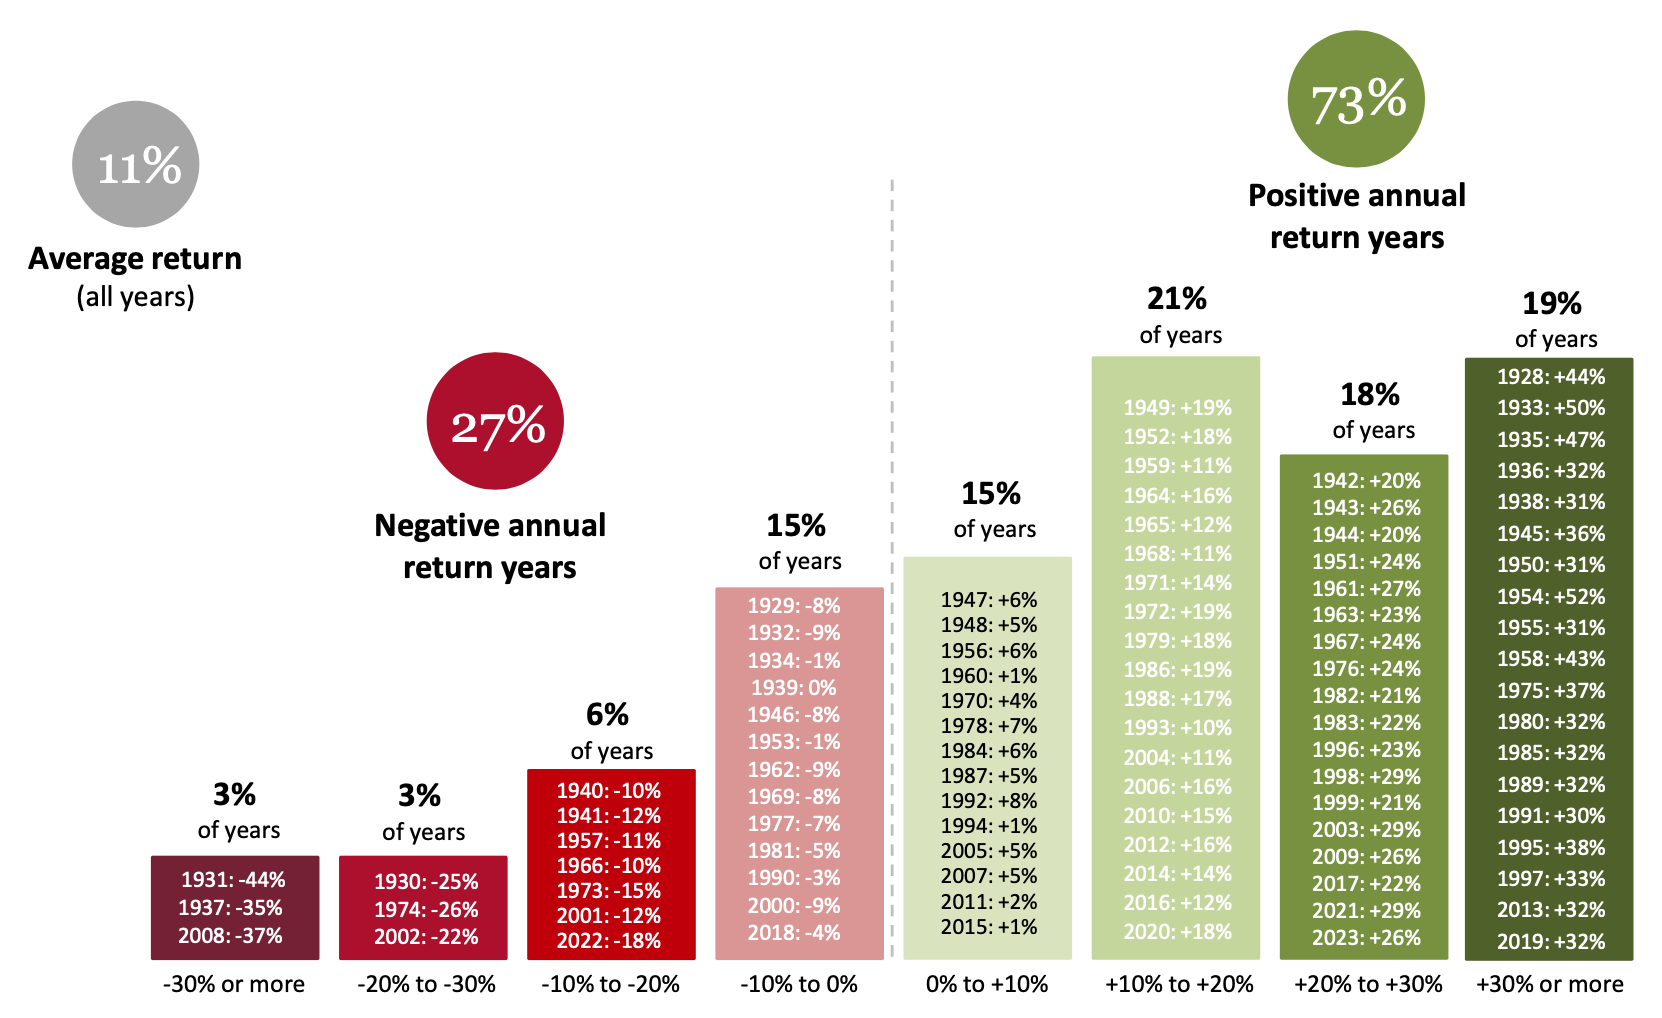
This chart shows the distribution of calendar year returns for the S&P 500 Index from 1928 through 2023.
Why is it important?
While the market has certainly suffered down years, they’ve been far outweighed by good – and even great – ones.
From 1928 to 2023, the average calendar year return for the S&P 500 Index was 11%.
Over that timeframe, 73% of yearly returns were positive while only 27% experienced a negative return.
Not only has the market risen far more often than it has fallen, many of the worst years for stocks were followed by strong rallies – rewarding investors who chose to stay the course.
Related: Shaping the Economic Landscape: Key Trends to Watch
Past performance is not indicative of future returns. Index performance is for illustrative purposes only. You cannot invest directly in the index.
Source: NYU.edu for S&P 500 returns (including dividends) from 1928 – 1936. Morningstar for returns from 1937 – 2023.
LCN-6306131-013024


