
Trending

From: Capital Group
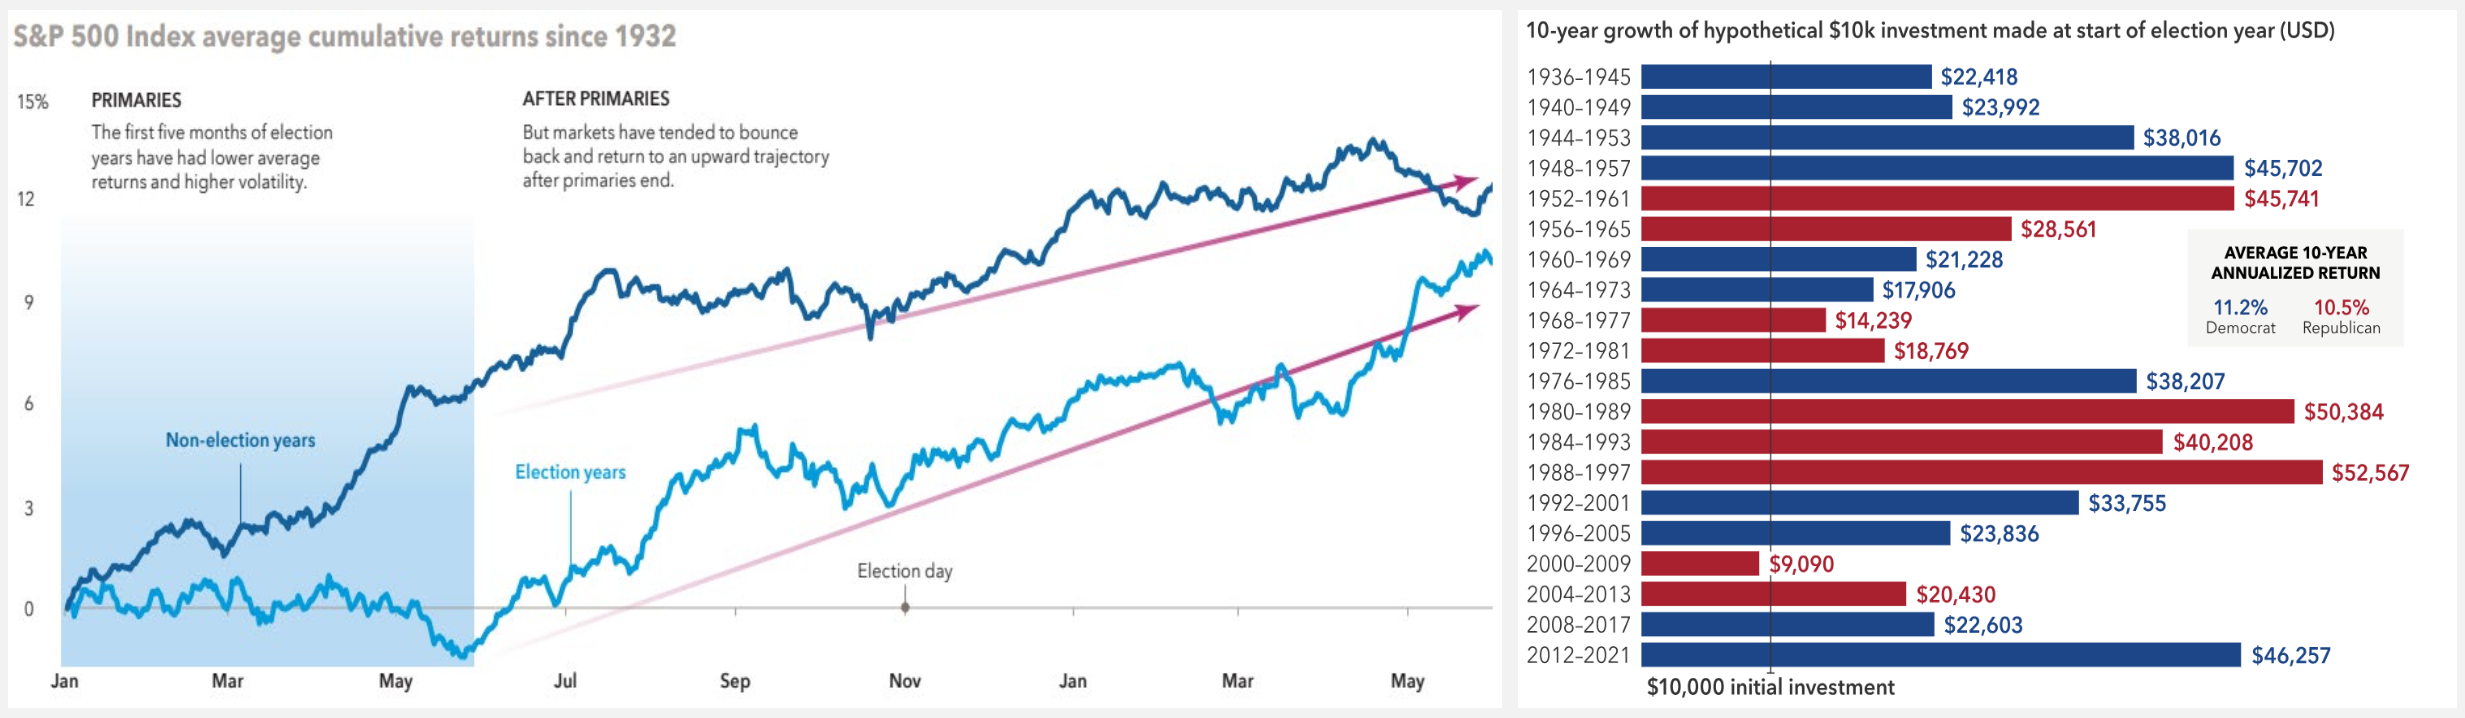
The first five months of election years have historically had lower average returns and higher volatility. However, regardless of outcome, markets tended to bounce back and return to an upward trajectory following both primaries and election days, when uncertainty is lifted. Despite the short-term volatility election years often bring, for long-term investors, the political party that wins the White House has had little impact on returns.
Since 1936, the 10-year annualized return of an investment in U.S. stocks (as measured by the S&P 500 Index) made at the start of an election year was strong, regardless of whether a Democrat or Republican prevailed.
Related: The Economy Drives Monetary Policy, Not Elections
Source: Capital Group, (left chart): Guide to Investing in an Election Year. Capital Group, IMES, Standard & Poor‘s. Includes all daily price returns from January 1, 1932, through December 31, 2022. Non-election years exclude all years with either a presidential or midterm elections. (Right chart): Sources: Capital Group, Standard & Poor’s. Each 10-year period begins on January 1 of the first year shown and ends on December 31 of the tenth year. For example, the first period covers January 1, 1936, through December 31, 1945. Figures shown are past results and are not predictive of results in future periods. https://www.capitalgroup.com/advisor/insights/articles/2024-economic-outlook.html?sfid=1995476238&cid=81086127&et_cid=81086127&cgsrc=SFMC&alias=btn-LP-A1cta-advisor.
LCN-6693388-061224