
Trending

What is this chart showing?
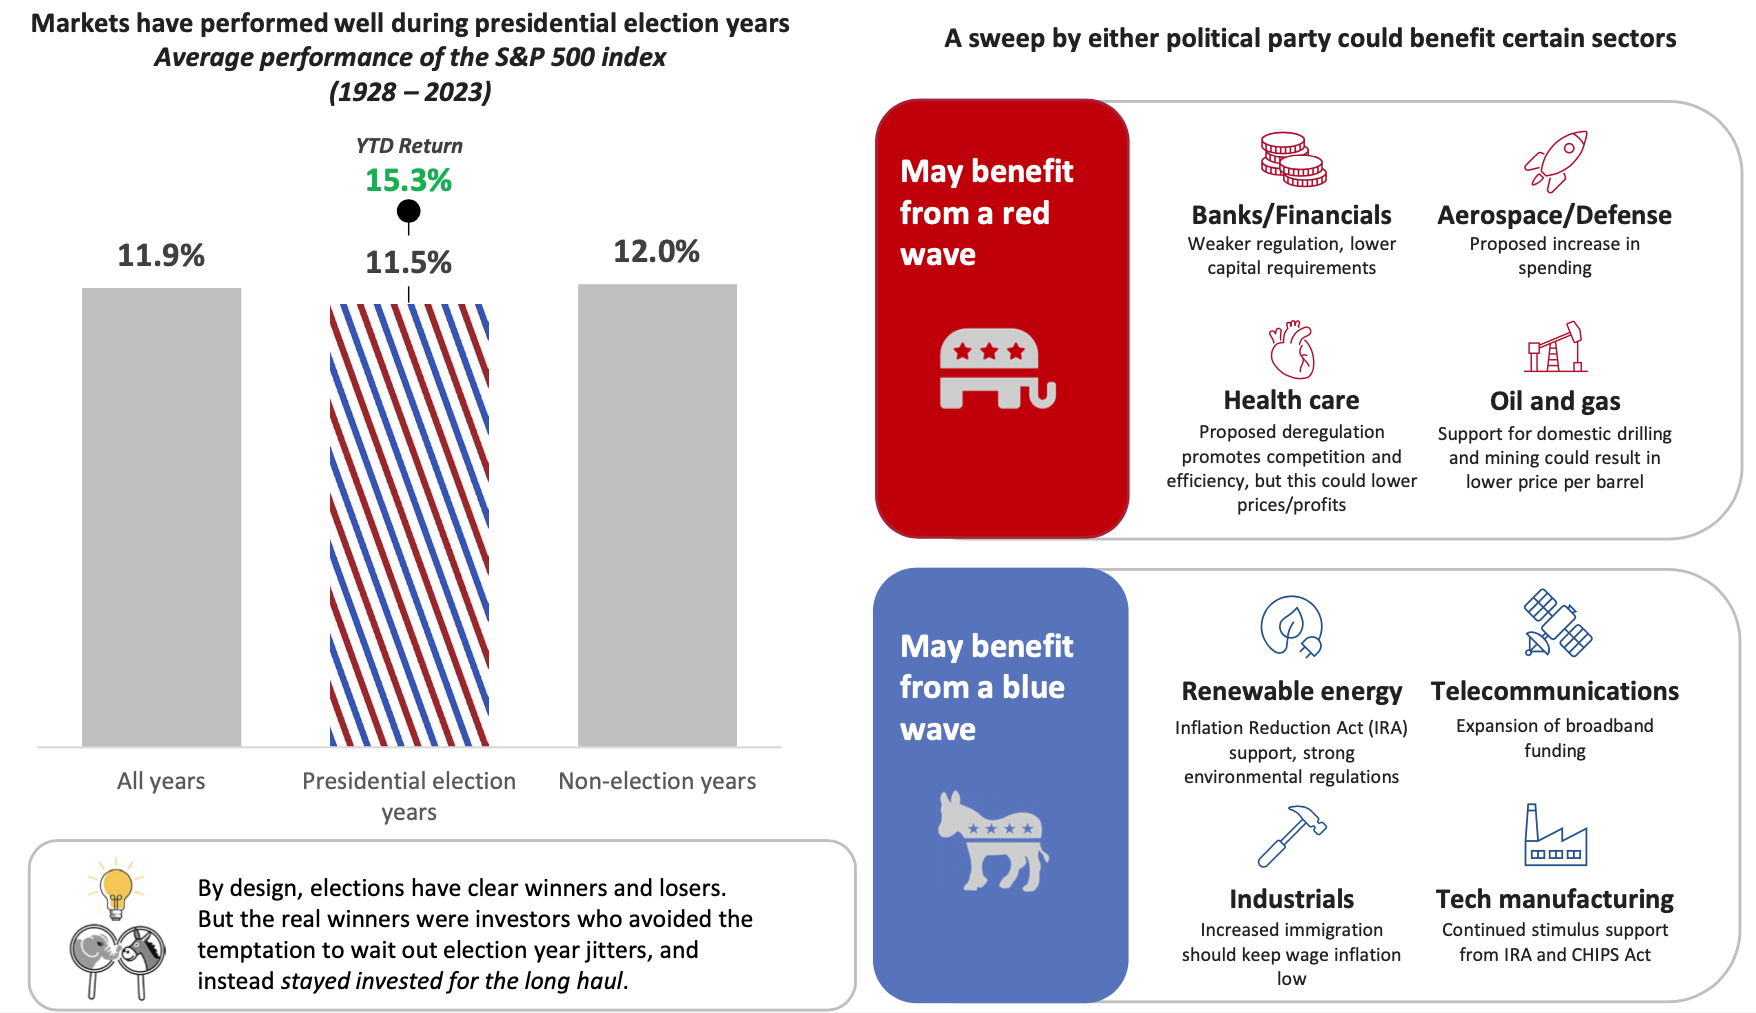
This chart shows the average performance of the S&P 500 since 1928 in three different scenarios: all years, presidential election years, and non-election years (left), as well as sectors that may benefit from a Republican or Democratic party sweep (right).
Why is it important?
People care about politics, markets do not. Stocks tend to do well in presidential election years, and 2024 has been no exception. All but four of the last 24 election years have seen stocks deliver positive returns, and three of those that did not were periods of economic crisis (1932, 2000, 2008).
In the near term though, political agendas could help boost individual sectors – especially in the case of a party controlling both the White House and Congress.
That said, attempting to position portfolios around the political outlook for certain sectors isn’t likely to be a winning strategy, as party goals are not the only factor influencing company results. Investors are better served tuning out the election noise and focusing on the long- term fundamental drivers of markets.
Related: Sequence of Returns: A Tale of Two Investors
Source: Morningstar, Capital Group, DFA Matrix book (Left): S&P 500 data sourced from DFA Matrix book from 1928 – 1936 then Morningstar from 1937 – 2023. Average of calendar year returns — total return including dividends. (Right): Capital Group, “Outlook: Midyear Issue: Long-term Perspective on Markets and Economies,” June 2024. https://www.capitalgroup.com/advisor/pdf/shareholder/MFCPBR-101-1053693.pdf.
Past performance does not guarantee or predict future performance. Index performance is for illustrative purposes only. You cannot invest directly in an index.
LCN-6693388-061224