What is this chart showing?
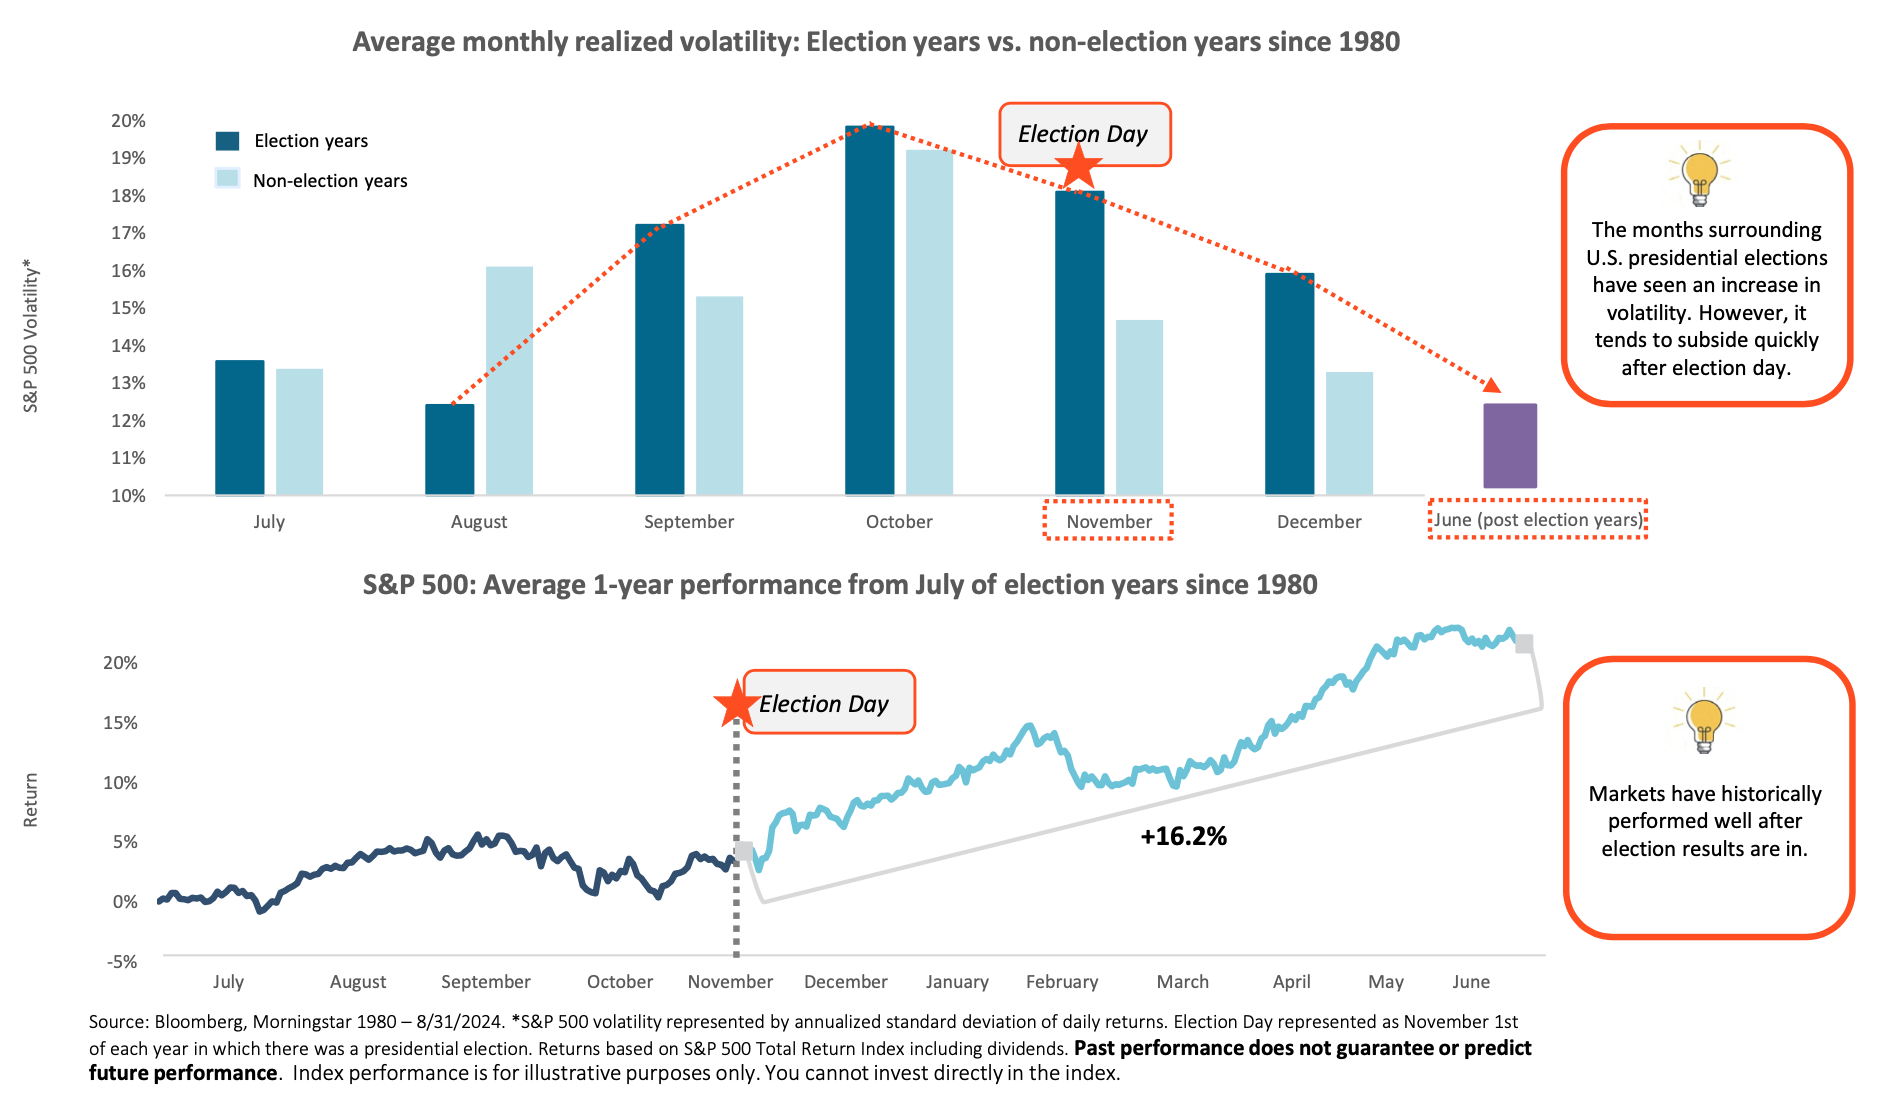
This chart shows average monthly realized volatility in the second half of election years and non-election years (top), as well as the average one-year return of the S&P 500 beginning in July of election years since 1980 (bottom).
Why is it important?
Based on trends, we shouldn’t be surprised if we see an increase in volatility leading up to the U.S. presidential election. That said, history shows that it may be temporary, as markets tend to calm rather quickly once the results are in.
A similar trend can be seen in stock prices, which on average have been choppy beginning in September and lasting into November of election years.
However, after Americans go to the polls, investors who stayed the course have historically been rewarded with strong gains, both in the short- and long-term.
On average, an investment made on November 1st of election years has rallied 16.2% over the next eight months and went on to gain 11.6% annually over the next decade.
Related: How the Start of the Fed Rate Cut Cycle Could Impact Investors


