What is this chart showing?
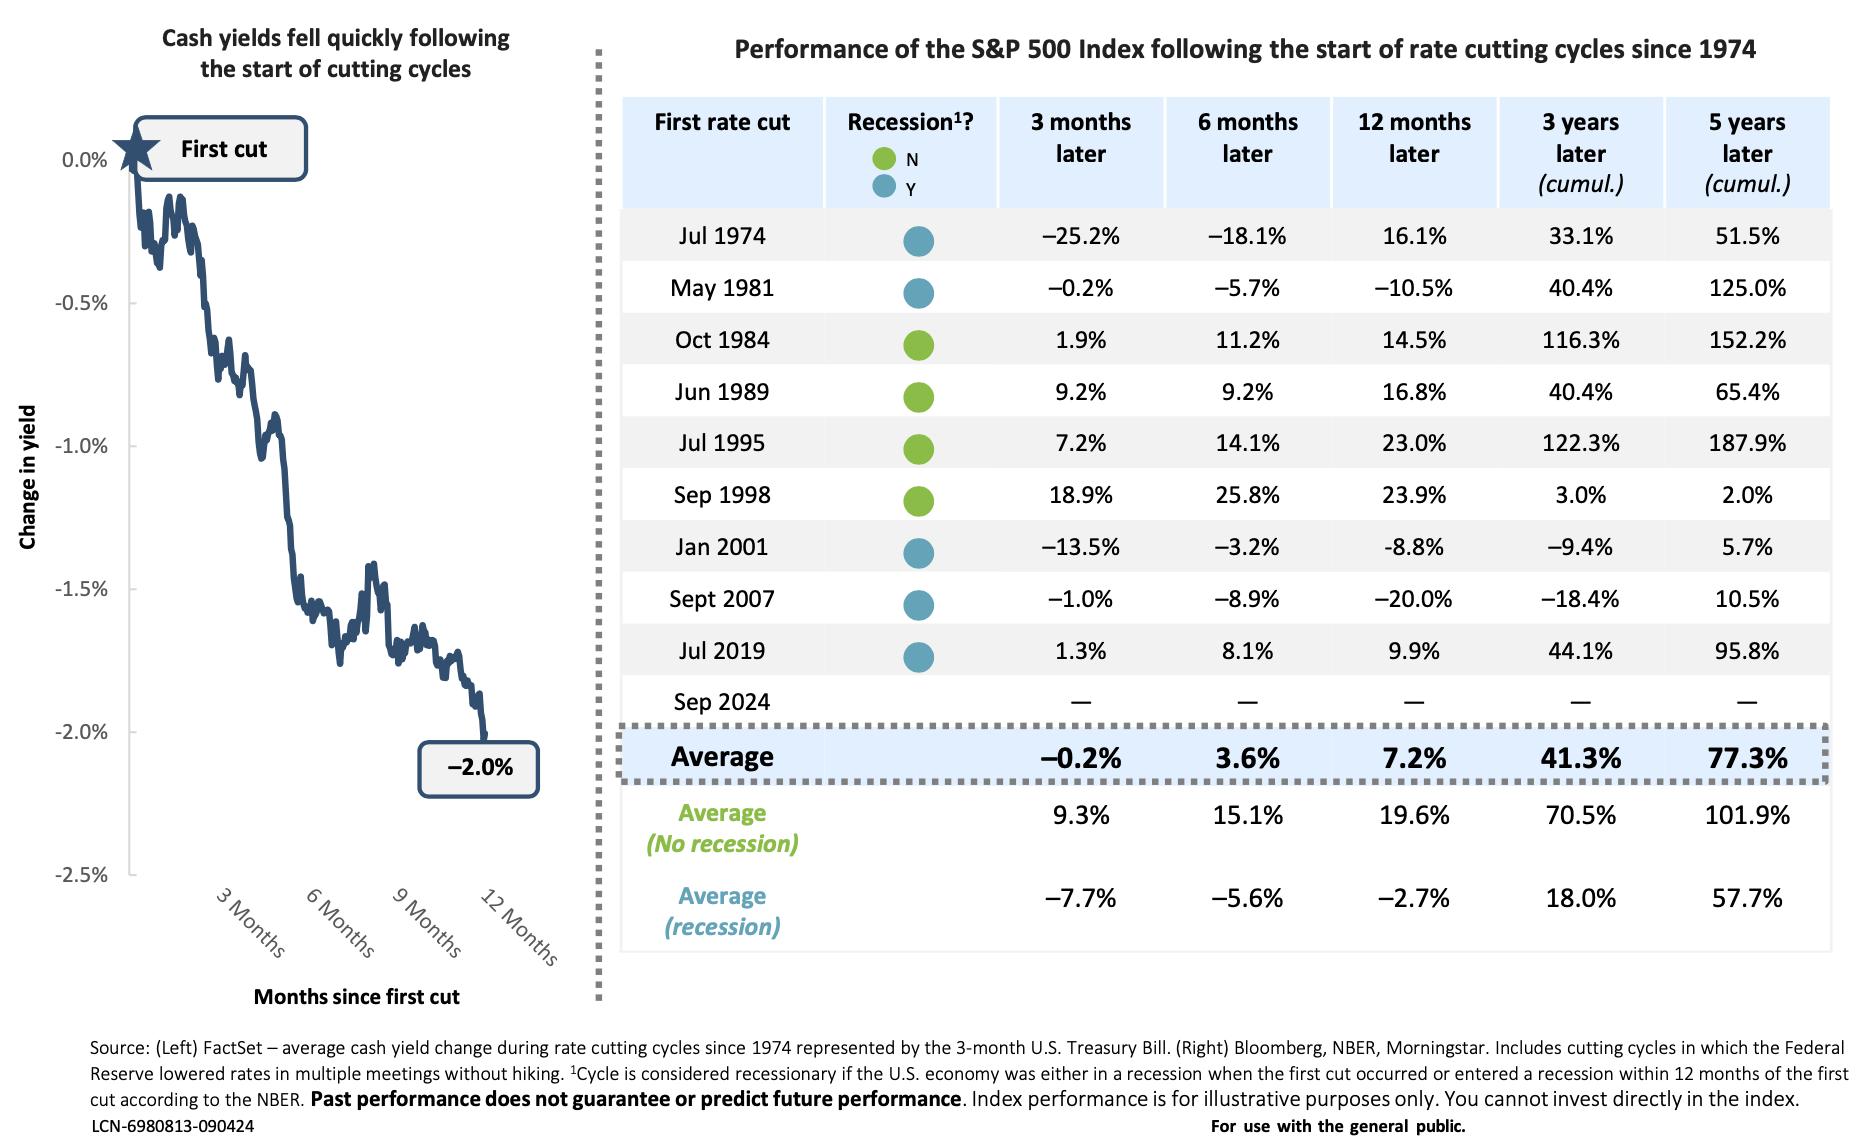
This chart shows the average change in cash yields over the 12 months following the start of rate cutting cycles (left), as well as the average return of the S&P 500 Index following the start of cutting cycles (right).
Why is it important?
The Federal Reserve kicked off its highly anticipated rate cutting cycle with a 50 basis point reduction in September 2024.
History shows cash yields decline rapidly following the start of cutting cycles, falling by 2% on average just twelve months later.
U.S. stocks have delivered a positive return of 7.2% one year after the initial cut, though depending on whether the economy avoids a recession or not within that year has led to starkly different results (+19.6% vs. –2.7%).
As of today, the economy shows no signs of an imminent recession, but this has the potential to change. However, as illustrated by longer-term returns, regardless of where the economy lands this cycle, patient investors should not be deterred from confidently staying the course.
Related: The Importance of Your Response to Market Volatility


