
Trending


What is this chart showing?
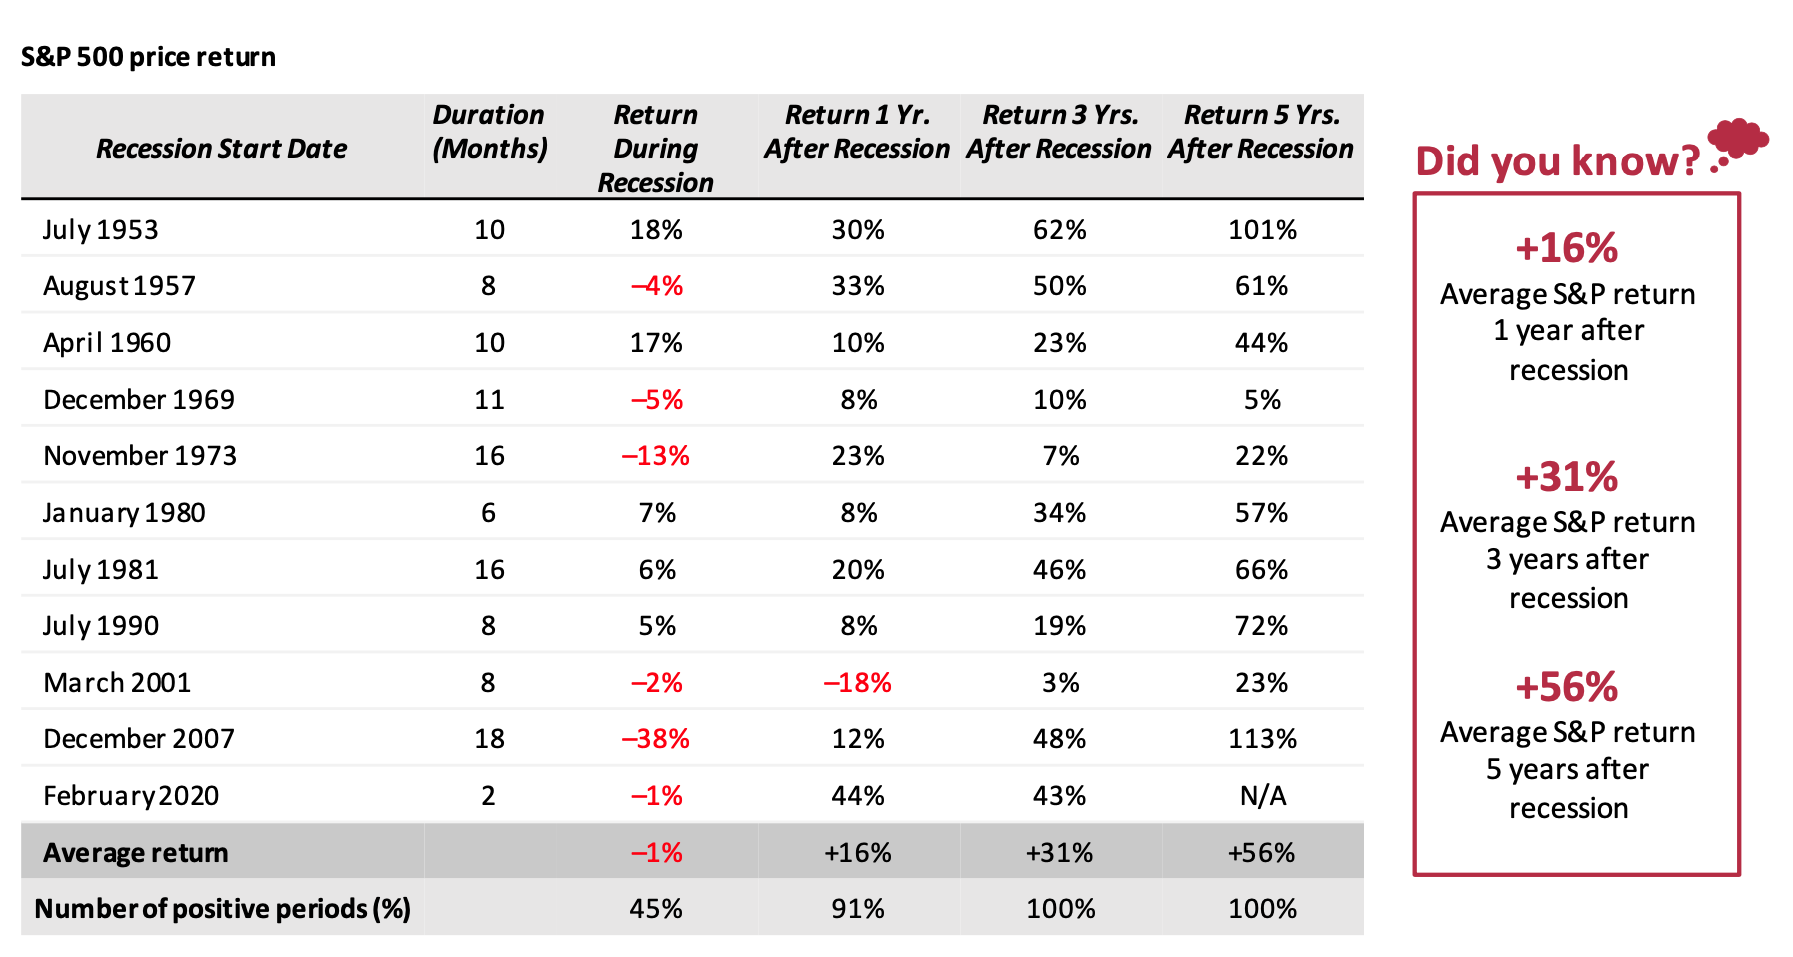
This chart shows performance of the S&P 500 in the periods before, during and after past U.S. recessions.
Why is it important?
Although recessions can be a time of uncertainty, investors likely shouldn’t let the prospect of a bumpy landing for the economy keep them from staying invested.
History shows that returns during recessionary periods havebeen relatively mixed,lending it self to the adage that the stock market is not the economy.
Returns following recessions have been strong, with cumulative gains 1, 3 and 5 years later of 16%, 31%, and 56%.
Additionally, the S&P 500 was negative only one time twelve months following the end of a recession and generated a positive return 100% of the time both 3 and 5 years later.
Source: Morningstar, NBER. Cumulative price return of the S&P 500 index. Past performance is not indicative of future returns. Recession duration is measured from the first day of the month following the peak month, to the end of the trough month.
LCN-5792016-070623