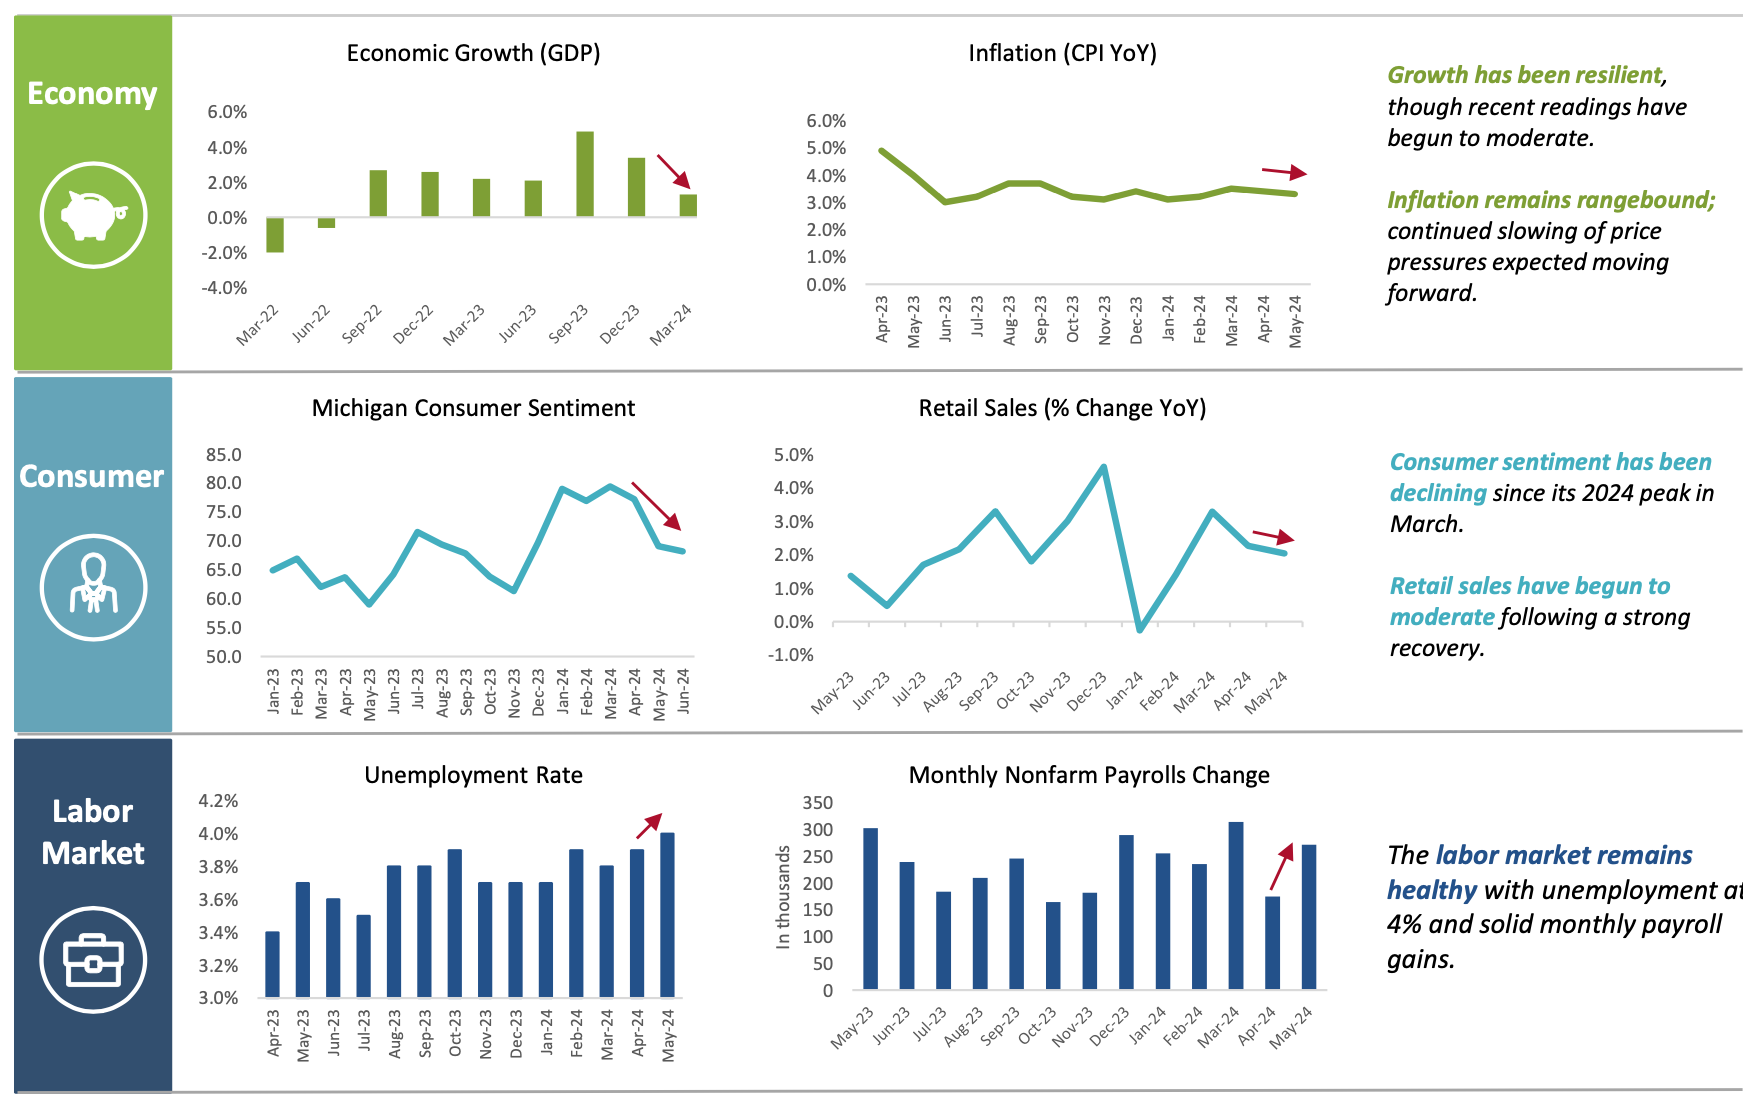
What is this chart showing?
This chart shows a dashboard of six macroeconomic indicators.
Why is it important?
Tracking the trends using a handful of key indicators can help investors keep a pulse on the health of the overall economy, and therefore the likelihood of a shift in monetary policy.
Throughout much of 2024, broad economic resiliency, combined with sticky inflation, has tempered expectations for the timing and magnitude of rate cuts. In the Federal Open Market Committee’s (FOMC) summary of economic projections following June’s meeting, the dot plot indicated that one interest rate cut is expected in 2024 – down from three following their March meeting.
More recent trends show a growing, yet modestly slowing economy.
While economic data - and therefore expectations for interest rates - can shift quickly, financial markets should benefit over time from a very resilient and dynamic U.S. Economy.
Related: The Economy Drives Monetary Policy, Not Elections
Source: See “Sources for Economic Trends” in appendix for disclosures.
LCN-6693388-061224


