
Trending

Stocks are predictably staging a continued recovery from the mostly sideways correction – a shallow one not strong enough to break the bulls‘ back. Credit markets are largely behaving – with the exception of long-term Treasuries, which I see as highly likely to draw the Fed‘s attention – just as I discussed in detail yesterday.
The S&P 500 keeps doing fine, and so does my open position there – in the black again. On one hand, volatility remains low regardless of intraday attempts to rise, on the other hand, the put/call ratio has risen quite high yesterday – it‘s as if the traders are expecting a shoe to drop, similarly to the end of Jan. Will it, is there any on the horizon?
Treasuries at the long-end are falling like a stone, and those on the short end (3-months) are seeing higher prices in 2021. The bond market is clearly under pressure, and exerting influence primarily upon precious metals (and commodities such as oil, which are experiencing a down day today, after quite a string of foreseeable gains).
The bearish sentiment in gold and miners is running rampant, and it‘s been only yesterday when I answered a question on ominous head and shoulders patterns in the making, at my own site. This clearly illustrates the razor edge we‘re at in precious metals:
(…) This is more often than not the case with H&S patterns – they are not the most reliable ones, highly judgemental at times, and their targets are more often than not far away, which makes them a not fully reliable trading proposition when a long enough time (trade) series is taken. I rather look at what is driving individual moves – which asset classes influence it the most at a given time? Where to look for so as to get most precise information? With gold and gold miners (they still trade quite tightly together), it's the Treasury yields on the long end.
As I wrote in today's (Feb 18) precious metals report, despite the new 2021 lows in TLT, gold isn't amplifying the pressure – it's trading well above the $1,770 level, and enjoys a stronger session today than silver. Look at the gold – TLT evolving relationship, as that's the key determinant right now. The post-Nov dynamic speaks in gold's favor – under the surface. Don't underestimate the Fed either.
Plenty to talk and cover in the precious metals really – just as usual at such crossroads. Let‘s briefly recap all the ducks lining up in stocks first.
Let‘s get right into the charts (all courtesy of www.stockcharts.com).
S&P 500 and Volatility
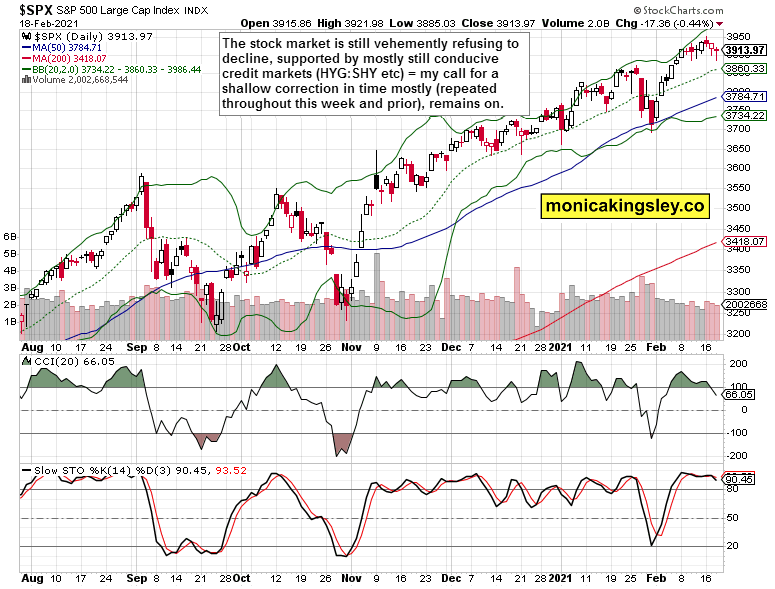
Repeated lower knots mark a refusal to decline as the daily dips keep being bought. Given the constructive developments in high yield corporate bonds and its key ratio (HYG and HYG:SHY), I fully expect the uptrend to keep reasserting itself once again. The talk about a top, imminent correction or stretched valuations, is still premature.
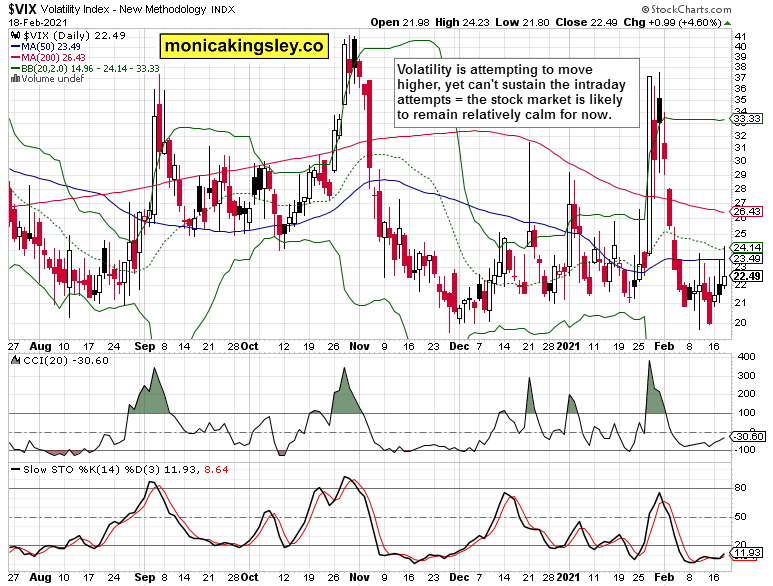
The best known volatility measure is still refusing to rise on a lasting basis, indicating that the environment remains favorable to higher stock prices.
Dollars and Treasuries
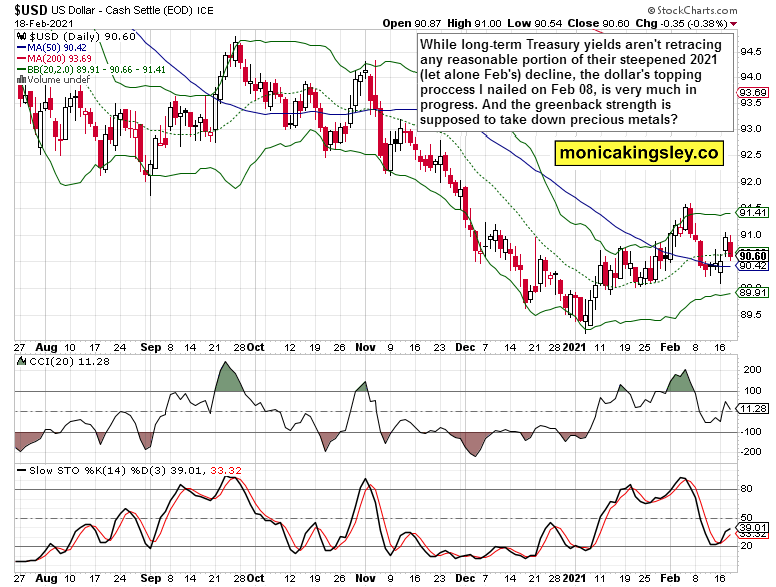
The world reserve currency is on the doorstep of another powerful decline, and not initiating a bull market run. The caption says it all – this is the time for antidollar plays to thrive in our era of ample credit, unprecedented money creation that‘s triggering a Roaring Twenties style of speculative environment, not a Kondratieff winter with a deflationary shock as you might hear some argue.
Look around, check food, energy, or housing prices, and you‘ll see how connected to reality are the calls of those writing that inflation isn‘t a problem (monetary inflation lifting many asset classes). Check that against Fed President Daly stating that the inflationary pressures now point downwards… and make your own conclusions about the new money wave hitting the real economy.
Gold Silver and Miners
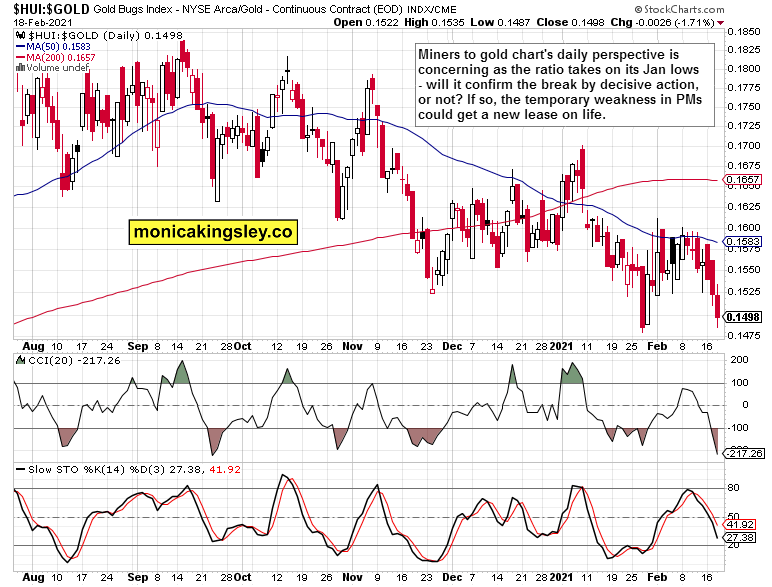
Just as gold is challenging (resting on) the late Nov lows, so is the miners to gold ratio. That‘s a key one – I mentioned at the very end of Jan that I would like to see it start to lead higher. Seeing the latest two-day losing streak, it‘s not happening, and the late Jan breakdown which might have turned out to be false, may not materialize in the short run. Let‘s get a proper perspective by displaying this chart in weekly format.
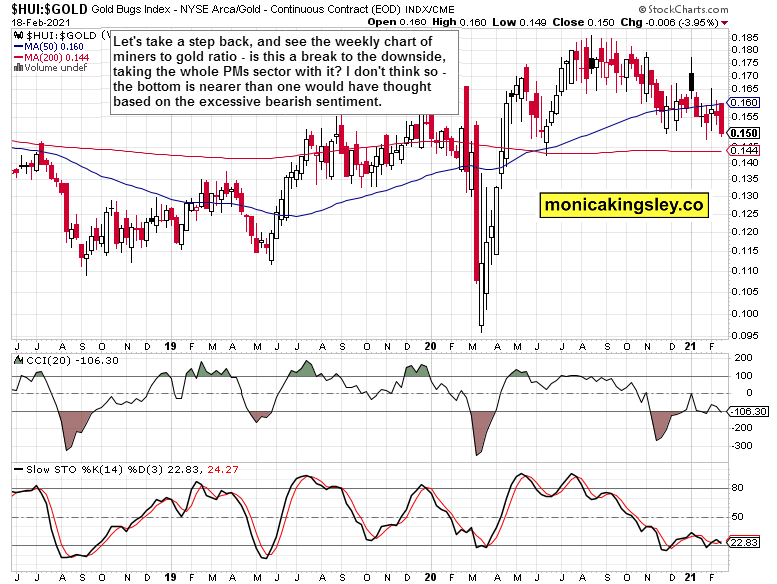
Is this the dreadful breakdown threating doom and gloom in the precious metals? Zooming out definitely provides a very different take – a more objective one than letting (fear) emotions run high and tickitis to take over.
We‘re still consolidating, and not making lower lows – regardless of this week‘s increased gold sensitivity to rising yields as seen in the plunging TLT values. Inflation is making its way through the system as surely as Titanic‘s watertight compartments were filled with water. I‘ve discussed on Wednesday at length inflation, past Fed action and asset appreciation, and yesterday explained why the central bank will be tied into a war on two fronts as it gets to seek control over the yield curve at the long end too.
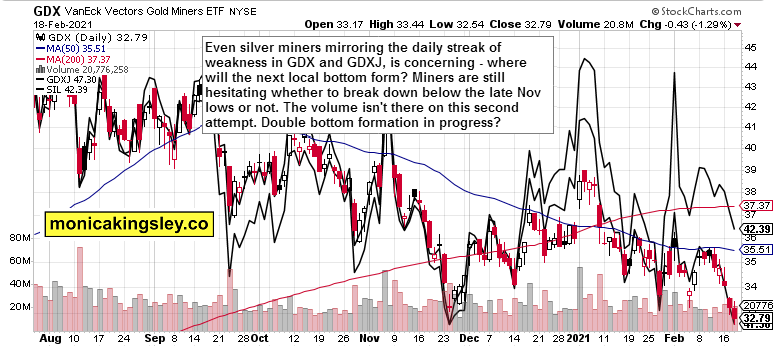
Another short-term worrying chart as silver miners are caught in last days‘ selling whirlwind. Even the juniors lost their short-term edge over the seniors, making me think that a potential washout event before a more universal sectoral rebound, might be at hand.
Pretty worrying for those who are all in gold – unless they took me up on last Friday‘s repeated idea that silver is going to outperform gold in the next precious metals upleg, which I formulated that day into a spread (arbitrage) trade long silver, short gold. Check out the following chart how that would have worked out for you.
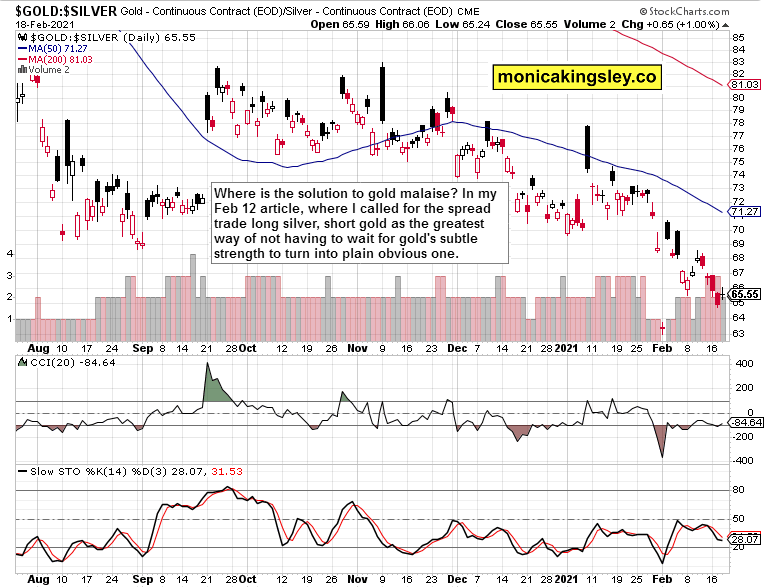
The dynamics favoring silver are unquestionable – starting from varied and growing industrial applications, strengthening manufacturing and economy recovery, poor outlook in silver above ground stockpile and recycling, to the white metal being also a monetary metal. Silver is bound to score better gains than gold, marred by the Bitcoin allure, would.
Summary
The bearish push in stocks didn‘t indeed take the sellers far – just as I wrote yesterday, there was no reason to hold on to your hat. The stock bull run is firmly entrenched, and there are no signals thus far pointing to an onset of a deeper correction right away as all we‘re going through, is a shallow correction (in time especially).
Bearish dollar, $1.9T or similar stimulus not priced in, and yet gold isn‘t taking a dive. Amid very positive fundamentals, it‘s the technicals that are short-term challenging for gold – we‘re in truly unchartered territory given the economic policies pursued. I stand by my call to watch the TLT chart very closely – it looks like an orderly TLT decline is what gold needs, not a selling stampede. Despite the current disclocation with gold being the weakest of the weak (I am looking at commodities for cues), I still stand by the call that a new PMs upleg is only a question of time – a shortening one, at that.
Thank you for having read today‘s free analysis, which is available in full at my homesite. There, you can subscribe to the free Monica‘s Insider Club, which features real-time trade calls and intraday updates for both Stock Trading Signals and Gold Trading Signals.
Related: Will We Finally See An S&P 500 Correction?
The views and opinions expressed in this article are those of the contributor, and do not represent the views of IRIS Media Works and Advisorpedia. Readers should not consider statements made by the contributor as formal recommendations and should consult their financial advisor before making any investment decisions. To read our full disclosure, please click here.